The Independent Market Observer

Slow Failure in Investing (It Happens)

March 13, 2015

Yesterday, we talked about the two kinds of investing failure: slow failure, where returns over time are too low to meet goals, and fast failure, which involves a sudden drawdown or loss. We’ll focus today on slow failure, as it’s the more insidious risk (and one that most people don’t think about in sufficient depth).

Continue reading → Leave a comment

Understanding the Risk of Investment Failure

March 12, 2015

As I mentioned yesterday, investment risk is often measured against the investments themselves, and for good reason. Too often, though, these measures don’t really capture the risk that individual investors face.

Today, we’ll talk about what risk really is, in an individual context, and start to think about what that means for measuring risk and constructing portfolios to avoid it.

Continue reading → Leave a comment

The Way We Measure Risk Is Wrong

March 11, 2015

Discussing returns over the next 10 years the other day, I closed with the thought that averages aren’t the best way to express how portfolios may perform. We will certainly talk about that today, but it’s emblematic of a much bigger problem: how we measure risk.

Continue reading → Leave a comment

Returns Over the Next Decade

March 9, 2015

As a follow-up to my post from last week, on the likely returns from bonds over the next five to ten years, I thought I’d extend that discussion to portfolios as a whole.

When we look at investment returns, we have a time-horizon problem. People in general aren’t very good at evaluating more than a year or so in each direction.

Continue reading → Leave a comment

The Role of Bonds in Portfolios Today

March 3, 2015

I am at the Commonwealth Leaders Conference this week, at one of the most beautiful properties I have ever seen. So, of course, I am sitting in a conference room listening to economic presentations. But I’m okay with that.

One of the great things about conferences like this one is that they offer the opportunity to listen to a group of sponsors present some of their most compelling investing ideas. I heard a very interesting point this morning that I’ve noted previously but not paid sufficient attention to: The return from bonds (in aggregate) is almost always very close to the initial yield.

Continue reading → Leave a comment

Bubble Trouble?

February 20, 2015

I wrote yesterday about gaps opening up in the stock market, and how the tech space in particular is starting to look a lot like a bubble.

Among other things, I mentioned that the stock market isn’t in a bubble yet because companies are making money. Later in the day, though, I saw a story pointing out that 71 percent of companies that went public last year were unprofitable, the highest level since 2000 (when 80 percent weren't making money).

Continue reading → Leave a comment

What Will the Market Return This Year?

February 13, 2015

I hope you enjoy today’s insightful post from my colleague Peter Essele. See you next week! — Brad

“What will the market return this year?” As a portfolio manager, I hear some variation of this question at the beginning of each and every calendar year. Following the requisite exchange of pleasantries, it inevitably comes up at cocktail parties, birthday get-togethers, client meetings, and even the après-ski scene.

Continue reading → Leave a comment

The Outside View: India

February 5, 2015

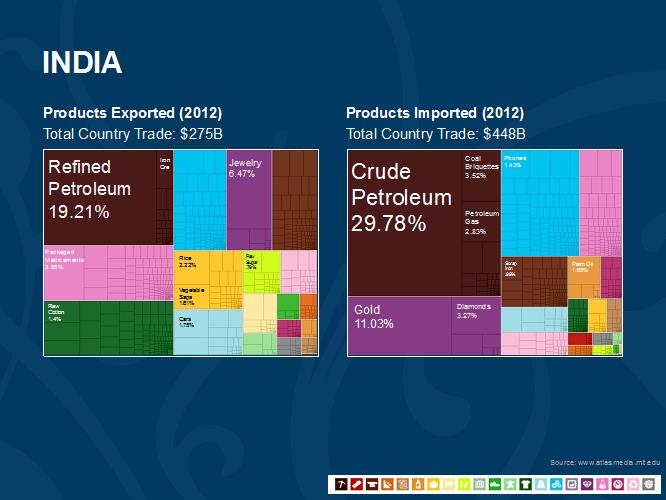
As we discussed yesterday, Brazil is different from the developed economies in Europe, Japan, and even China, and it presents a different kind of opportunity for investors. With an economy halfway between those of Brazil and China, and a set of advantages that both other countries lack, India is potentially an even more interesting opportunity.

Continue reading → Leave a comment

The Outside View: Brazil

February 4, 2015

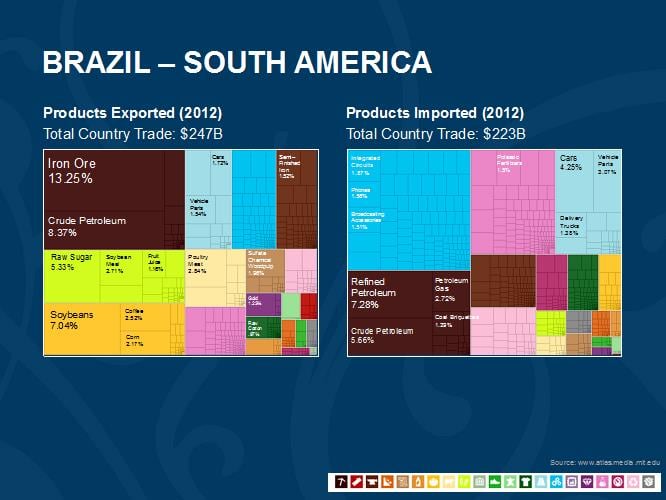
Since it's a fairly quiet news day, I want to return to our "outside view" series on countries that matter around the world. So far, we’ve considered China, Europe, and Japan, but today we’ll shift gears and look at a very different country, Brazil.

Continue reading → Leave a comment

Making Sense of Mutual Fund Gains and Losses

February 2, 2015

Driving in Massachusetts can be confusing. South Boston, for example, is actually east of the city, while East Boston is to the north. And the road labels can be just as bad. There is a section of a major highway, where two roads converge, where you can actually be headed south on one highway and north on another at the same time.

Hard to believe—and even harder to describe when you try to give directions—but true. Don’t try this if you’re not from around here.

Continue reading → Leave a comment

Subscribe via Email

Crash-Test Investing

Hot Topics


New Call-to-action

Conversations

Archives

see all

Subscribe


Disclosure

The information on this website is intended for informational/educational purposes only and should not be construed as investment advice, a solicitation, or a recommendation to buy or sell any security or investment product. Please contact your financial professional for more information specific to your situation.

Certain sections of this commentary contain forward-looking statements that are based on our reasonable expectations, estimates, projections, and assumptions. Forward-looking statements are not guarantees of future performance and involve certain risks and uncertainties, which are difficult to predict. Past performance is not indicative of future results. Diversification does not assure a profit or protect against loss in declining markets.

The S&P 500 Index is a broad-based measurement of changes in stock market conditions based on the average performance of 500 widely held common stocks. All indices are unmanaged and investors cannot invest directly in an index.

The MSCI EAFE (Europe, Australia, Far East) Index is a free float‐adjusted market capitalization index that is designed to measure the equity market performance of developed markets, excluding the U.S. and Canada. The MSCI EAFE Index consists of 21 developed market country indices.

One basis point (bp) is equal to 1/100th of 1 percent, or 0.01 percent.

The VIX (CBOE Volatility Index) measures the market’s expectation of 30-day volatility across a wide range of S&P 500 options.

The forward price-to-earnings (P/E) ratio divides the current share price of the index by its estimated future earnings.

Third-party links are provided to you as a courtesy. We make no representation as to the completeness or accuracy of information provided on these websites. Information on such sites, including third-party links contained within, should not be construed as an endorsement or adoption by Commonwealth of any kind. You should consult with a financial advisor regarding your specific situation.

Member FINRASIPC

Please review our Terms of Use

Commonwealth Financial Network®