Now that we've looked at China and Europe, it’s time to examine Japan’s economic future.
Exports: an increasingly competitive environment
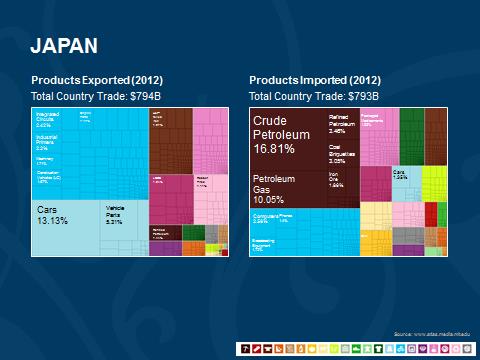
In its export structure, Japan is generally similar to both China and Europe, as we can see in the charts below.

Japan’s exports are largely manufactured goods, and the total mix is quite similar to that of Germany. Although slightly more developed than China’s, this mix is what China is aiming for in the near future. As with China and Europe, imports are dominated by energy. Overall, the similarities are greater than the differences, at least as far as imports and exports go.
This is a point worth expanding on, and it only gets stronger as we add more countries to the analysis. With very similar export and import mixes, Japan is competing more or less directly with Europe and China, which are also competing with each other.
This means any growth in exports—which is to say, any economic growth in heavily export-dependent economies—is no longer a matter of expanding into an open market, but of direct competition. For Japan to sell more, China or Europe has to sell less. I will elaborate on this in another post, but the clear consequence is that growth will be harder to get, profits will be lower, and countries will seek other advantages, such as a cheap currency, in order to maximize their success in this newly competitive environment.
Fiscal balance: a major debt burden
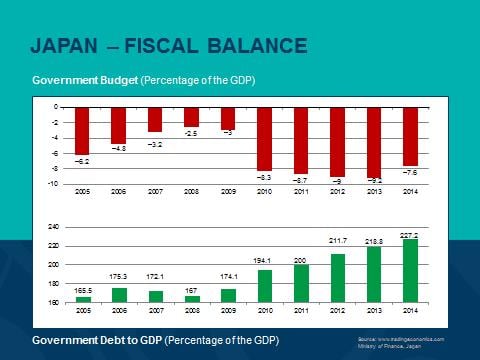
Beyond the direct competition Japan now faces, there is another specific problem—government spending and accumulated debt. Looking at the fiscal balance numbers, Japan is in a league of its own among major countries for both ongoing deficits and accrued debt.

Recent policy measures have included extensive quantitative easing in a desperate attempt to grow the economy fast enough to reduce the deficits and repay this debt. As a happy (and intended) side effect, these measures have also reduced the value of the yen, making Japanese exporters more competitive. Imagine, for example, a Lexus priced 5 percent cheaper in dollars than a competing Mercedes. Think that might drive some more sales?
Can Japan recover? The real question about Japan isn’t whether it can continue to compete—it can, although it will be tougher than it has been—but whether it can come back from its current debt burden.
Recoveries of similar magnitude have happened. For example:
- Australia had a debt-to-GDP ratio of almost 200 percent during the Great Depression and of more than 180 percent during World War II.
- Canada’s debt-to-GDP ratio peaked at more than 150 percent during World War II.
- France had spikes of more than 240 percent during the two World Wars.
All subsequently managed to bring their debt down to manageable levels.
More recent examples haven’t been nearly as extreme, but Canada, Sweden, and Spain have all hit high debt levels (for the postwar period) and then driven them down. Those successes, however, were for much smaller economies, from much lower debt levels—around 70 percent of GDP—and in much higher-growth environments.
In the past 50 years, there is no parallel for a recovery like the one Japan must make.
Conclusion: investors should be cautious
Japan is attacking its debt problem on a couple of fronts—notably, by devaluing the currency to boost exports and create inflation—but whether it can succeed is a very open question. An outside view suggests it’s possible but probably not likely.
As investors, we should be aware of this, and of the factors that suggest further currency devaluation is pretty much inevitable, even if the Japanese economy itself can compete.


 Print
Print


