Overall, last week’s economic data was rather disappointing, marked by an industrial slowdown and lackluster retail sales. Let’s take a closer look.


Overall, last week’s economic data was rather disappointing, marked by an industrial slowdown and lackluster retail sales. Let’s take a closer look.

January 15, 2016
The market sell-off continues, and as the slide gets more severe, we have to ask ourselves, once more, how worried we should be.
I’ve written over the past couple of days that it's not time to panic, and I still believe that's true. But it appears there may be more short-term damage than I initially thought. Now, the question is, how much worse might it get, and what does that mean for us as investors?
January 14, 2016
If you’ve been following my posts lately, you know that I’m not panicking about the current market decline. In fact, despite yesterday’s drop, I believe the market situation is normal, reasonable, and not likely to turn into a 2008.
On the other hand, it’s always worth considering how and why you could be wrong. So let’s make the opposite case and argue for a crash. What evidence do we have that the world is coming to an end?

January 13, 2016
This week, two major banks—the Royal Bank of Scotland and J.P. Morgan—issued some alarming advice for investors: sell your stocks, as the end is nigh. They didn’t use those exact terms, but the message was clear enough.
January 12, 2016
Now that the equity markets seem to have stabilized a bit, let’s return to what underlies much of the current turmoil: the market for oil. The conversation usually centers on the price of oil, but the price is merely a symptom, not the cause.
January 11, 2016
Last week was a big one for economic data, with important releases on business and jobs, plus insights into the Fed's outlook.
January 8, 2016
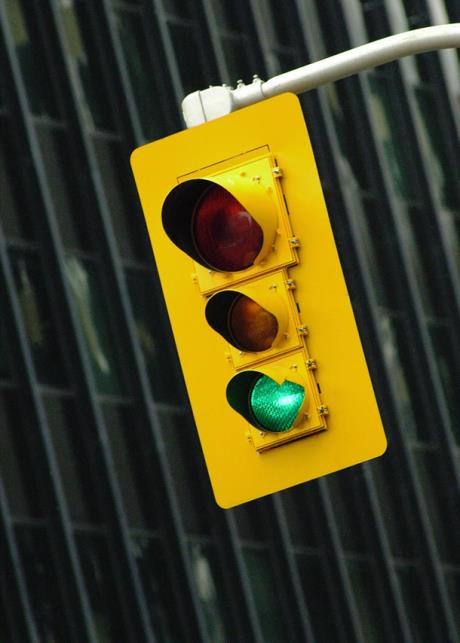
Once again, it’s time for our monthly update on risk factors that have proven to be good indicators of economic trouble ahead. Last month, we got our first yellow light (in consumer confidence), which continues this month despite substantial improvement in that area. Although there were some indications of weakness in other parts of the economy in December, we also saw positive signs, notably in employment. Overall, the picture this month is somewhat better than last month.
January 7, 2016
I still want to talk more about oil and the Middle East, and I will, but the more urgent topic is China. What is going on there, and what does it mean for us here in the U.S.?
January 6, 2016
In my latest Market Thoughts video, I look back at 2015, which was actually the worst year for the markets since the financial crisis, but a solid year for the ongoing economic recovery.
January 6, 2016
In shades of last August, the Chinese stock market breaks down, markets around the world drop, and everyone starts to wonder one thing: just how bad can it get?


