 In shades of last August, the Chinese stock market breaks down, markets around the world drop, and everyone starts to wonder one thing: just how bad can it get?
After a difficult Monday and another down morning today, let’s consider that question in detail.
From a big-picture perspective, I suspect the damage will be both limited and short lived. That’s not to say the market downturn can’t get worse, but major pullbacks—drops of more than 20 percent—typically only occur when there has been a recession, a commodity price spike, aggressive Fed rate increases, or very high market valuations. Right now, we just have the last one, and even that’s arguable.
Where the market could be headed
That said, it’s quite possible we could see more declines. Although the fundamentals remain reasonably strong, valuations are indeed high, and the market has sustained real technical damage. It appears there may be a significant break in confidence, which could well lead to further downward movements.
To help frame our discussion, let’s review what declines of different magnitudes would look like for the S&P 500 Index. (All figures are rounded.)
- Market top – 2,135
- 10-percent correction – 1,921
- 15-percent correction – 1,815
- 20-percent bear market – 1,708
As I write this, the market is around 2,000, or down about 6 percent. A drop to a 10-percent correction would mean losing another 80 points, while a move to a bear market would mean losing another 300 points. I’m not saying any of this will happen, but these are the numbers we’d see if it did.
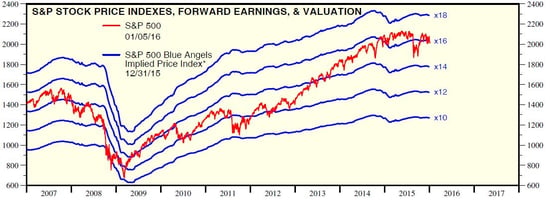
Now let’s look at valuations, which have bounced around between 10x and 18x forward earnings since before the crisis, as shown in this chart from Yardeni Research.

Source: yardeni.com
With estimated forward earnings at $126.76, the valuation range above would result in the following values for the S&P 500, rounded to the nearest 10:
- 16x = 2,028
- 14x = 1,775
- 12x = 1,521
We’re now at 15.8x or so, above the 15x level that prevailed in 2007 and above (or close to) all of the post-crisis valuations since the end of 2013. In other words, we’re still above the valuations that prevailed until pretty recently, as well as above the levels just before the crisis.
From a valuation perspective, then, there appears to be room for a further decline. The question is how far it could go.
Let’s play out a worst-case scenario
With the exception of crisis periods, such as 2008 and 2011, valuations tend to bottom out around 10x–12x. Despite everything that is happening, I don’t believe we are in a crisis approaching the magnitude of either of those periods. Given strong fundamentals here in the U.S., even if the rest of the world does get worse, we’re likely to ride out the turmoil much more easily, making a drop to 14x a reasonable worst-case scenario. (That would actually be worse than where we bottomed in August, after the last Chinese pullback.)
A market valuation of 14x puts the S&P 500 at around 1,775, representing a decline of about 17 percent from the peak and an additional decline of 225 points from where we are right now. In other words, the S&P 500 may still have further to fall if we drop to noncrisis bottom valuation levels. This is a reasonable worst case in the absence of a recession, commodity spike, or the other factors typically associated with bear markets.
Markets may well be stabilizing, but even if they do, it’s important to understand the downside exposure that will remain. Fundamentals are strong and should limit damage, but further volatility is quite possible.
At the same time, let's not forget that valuations didn’t even get close to 14x after the last Chinese market pullback. Although it’s good to keep an eye on the numbers, what happened last time suggests things may not be as bad this time, either.


 Print
Print


