Overall, last week’s economic data was rather disappointing, marked by an industrial slowdown and lackluster retail sales. Let’s take a closer look.


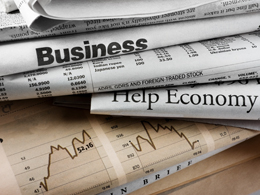
Overall, last week’s economic data was rather disappointing, marked by an industrial slowdown and lackluster retail sales. Let’s take a closer look.

January 15, 2016
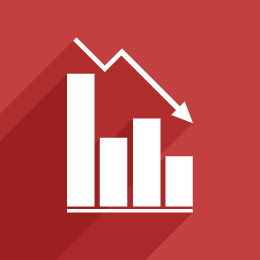
The market sell-off continues, and as the slide gets more severe, we have to ask ourselves, once more, how worried we should be.
I’ve written over the past couple of days that it's not time to panic, and I still believe that's true. But it appears there may be more short-term damage than I initially thought. Now, the question is, how much worse might it get, and what does that mean for us as investors?

January 14, 2016
If you’ve been following my posts lately, you know that I’m not panicking about the current market decline. In fact, despite yesterday’s drop, I believe the market situation is normal, reasonable, and not likely to turn into a 2008.
On the other hand, it’s always worth considering how and why you could be wrong. So let’s make the opposite case and argue for a crash. What evidence do we have that the world is coming to an end?

January 13, 2016
This week, two major banks—the Royal Bank of Scotland and J.P. Morgan—issued some alarming advice for investors: sell your stocks, as the end is nigh. They didn’t use those exact terms, but the message was clear enough.
January 12, 2016
Now that the equity markets seem to have stabilized a bit, let’s return to what underlies much of the current turmoil: the market for oil. The conversation usually centers on the price of oil, but the price is merely a symptom, not the cause.
January 11, 2016
Last week was a big one for economic data, with important releases on business and jobs, plus insights into the Fed's outlook.

January 7, 2016
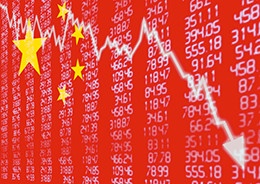
I still want to talk more about oil and the Middle East, and I will, but the more urgent topic is China. What is going on there, and what does it mean for us here in the U.S.?
January 5, 2016
It certainly didn’t take long for markets to set the tone in 2016.
The first trading day of the year kicked off with big declines around the world, and investors were quick to start worrying. At 9:40 A.M. yesterday, someone asked me what I thought of the “January effect”—the notion that what happens in January determines the outcome for the year—and if I believed 2016 would be a washout. My response, in brief, was that 10 minutes probably isn’t a long enough time frame to judge the entire year.
January 4, 2016
Last week was a short one thanks to the New Year holiday, with limited economic data released. Overall, the data was positive, indicating that improved consumer confidence should continue to drive the economy. But one of the major components, housing, may be slowing down, suggesting more of a slow but steady recovery.
December 28, 2015
On a shortened week with the Christmas holiday, last week’s data releases gave a mixed look at the consumer and business sectors, with notably different results.


