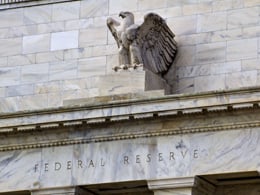
The outcome of this week’s Federal Reserve meeting was as everyone had expected: the Fed raised short-term rates by 25 basis points. The surprising part was the more hawkish tone of the surrounding commentary.
December 15, 2016
The outcome of this week’s Federal Reserve meeting was as everyone had expected: the Fed raised short-term rates by 25 basis points. The surprising part was the more hawkish tone of the surrounding commentary.
December 14, 2016
Over the past couple of years, I’ve written several posts that explained why U.S. market indices are not the best ways to measure your portfolio. Although it’s natural to look at the Dow, for example, and see how it matches up with your own portfolio, it really isn’t a good comparison.
December 13, 2016
Just as I do with the economy, I review the market each month for warning signs of trouble in the near future. Although valuations are now high—a noted risk factor in past bear markets—markets can stay expensive (or get much more expensive) for years and years, which doesn’t give us much to go on timing-wise.
December 12, 2016
Once again, last week’s economic reports were surprisingly strong, with most consumer and business data beating expectations, often significantly.
December 9, 2016
I remember when the Dow Jones Industrial Average hit 10,000, both going up and going down. It was a lot more fun going up, especially the first time. The index is now approaching double that level—Dow 20,000. If we get there, it should be exciting.
December 9, 2016
The markets have continued to rally since the election, reaching all-time high after all-time high. Should we be nervous about a short-term pullpack?
December 8, 2016
My colleague and friend Peter Essele, portfolio manager here at Commonwealth, has again put together an interesting piece highlighting the gap that often exists between what investors expect and what the market gives them. Although it’s a bit technical, the point is very important given recent moves in interest rates and the ongoing search for yield by many investors.
December 7, 2016
In the wake of the election, many of the economic indicators we track here each month saw substantial improvement. There was some weakness going into the election, but the news since then has been stronger. Although job growth continues to tick down, consumer confidence has rebounded in a big way, and business confidence has also continued to move higher.
December 6, 2016
With U.S. stocks surging to new highs and trouble brewing elsewhere in the world (the failed Italian referendum and resignation of Matteo Renzi, not to mention the continued decline in the Chinese currency), I’ve been getting questions about whether investors should just stay here in the USA.
December 5, 2016
Last week’s economic reports were surprisingly strong, with both consumer and business data beating expectations, often by significant amounts. These results support the idea that the economy continues to improve—and that the improvement appears to be accelerating.

Episode 17
March 18, 2026
Episode 16
February 11, 2026
Episode 15
January 15, 2026
Episode 14
December 17, 2025
Episode 13
November 19, 2025
The information on this website is intended for informational/educational purposes only and should not be construed as investment advice, a solicitation, or a recommendation to buy or sell any security or investment product. Please contact your financial professional for more information specific to your situation.
Certain sections of this commentary contain forward-looking statements that are based on our reasonable expectations, estimates, projections, and assumptions. Forward-looking statements are not guarantees of future performance and involve certain risks and uncertainties, which are difficult to predict. Past performance is not indicative of future results. Diversification does not assure a profit or protect against loss in declining markets.
The S&P 500 Index is a broad-based measurement of changes in stock market conditions based on the average performance of 500 widely held common stocks. All indices are unmanaged and investors cannot invest directly in an index.
The MSCI EAFE (Europe, Australia, Far East) Index is a free float‐adjusted market capitalization index that is designed to measure the equity market performance of developed markets, excluding the U.S. and Canada. The MSCI EAFE Index consists of 21 developed market country indices.
The Dow Jones Industrial Average is computed by summing the prices of the stocks of 30 large companies and then dividing that total by an adjusted value, one which has been adjusted over the years to account for the effects of stock splits on the prices of the 30 companies. Dividends are reinvested to reflect the actual performance of the underlying securities.
The Russell 2000 is a market-capitalization weighted index, with dividends reinvested, that consists of the 2,000 smallest companies within the Russell 3000 Index. It is often used to track the performance of U.S. small market capitalization stocks.
One basis point (bp) is equal to 1/100th of 1 percent, or 0.01 percent.
The VIX (CBOE Volatility Index) measures the market’s expectation of 30-day volatility across a wide range of S&P 500 options.
The forward price-to-earnings (P/E) ratio divides the current share price of the index by its estimated future earnings.
Third-party links are provided to you as a courtesy. We make no representation as to the completeness or accuracy of information provided on these websites. Information on such sites, including third-party links contained within, should not be construed as an endorsement or adoption by Commonwealth of any kind. You should consult with a financial advisor regarding your specific situation.
Member FINRA, SIPC
Please review our Terms of Use.
Commonwealth Financial Network®