 Over the past couple of weeks, everyone’s been wondering how long the stock market's “Trump bounce” will last. Several people have asked me whether a pullback is due and how bad it might be. Even as markets move higher, there is quite a bit of worry.
I wish I could predict short-term market movements, but I can’t. What I can do is highlight some factors that are driving the markets right now and that will probably continue to do so. That should give us some idea about where markets are headed in the medium term.
As I said after the election, the immediate bounce seemed largely due to a sudden reduction in uncertainty. Instead of a contested election, we had a clear result and a unified government. That alone made investors feel better, pushing the market up.
Since then, the news has only improved in many respects. Economic data continues to come in strong, and the political scene is becoming more clear, which has certainly helped keep the rally going. At some point, though, this kind of feel-good information can fade, and that is what’s prompting the worry right now.
How long can the market keep rising on good general data? Probably not all that long. The real reason the rally may continue is that there has also been significant improvement in stock market-specific fundamentals.
Strong earnings could keep the party going
Companies are earning more money and are expected to continue to do so at an accelerating rate. Third-quarter earnings season is largely over, with 98 percent of the S&P 500 reporting, so we can evaluate how the fundamentals look going forward.
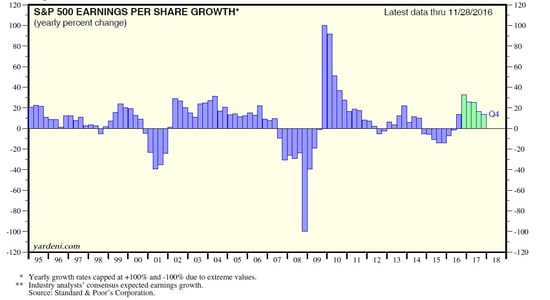
First, the big picture: aggregate earnings are up 3.2 percent for the quarter, including estimates for companies yet to report. That doesn’t sound all that great, and it isn’t, but compared with initial expectations for a decline of 2.2 percent, it looks much better. We also saw the first annual growth in earnings, of 0.5 percent, since the first quarter of 2015. In other words, for the first time in quite a while, companies are actually making more money rather than less. This has to help the market.
Looking at the details, the news gets even more promising. All 11 sectors did better than expected and are growing at a faster rate. This is a broad-based recovery. If you exclude the weak energy sector, earnings growth more than doubles, to 6.5 percent. Leaving out the bad stuff usually isn't good practice, but in this case, it may be justified to get a look at the broader trends. Put another way, all that needs to happen to double earnings growth is for the energy sector to stay flat.
In fact, with continued improvement in the economy, not just here in the U.S. but around the world, energy and all the other sectors are likely to do better. As you can see in the chart below from Yardeni Research, earnings growth is expected to accelerate dramatically, which is consistent with both history and the economic fundamentals.

At the moment, pullback not in view
All told, the initial market bounce reflected a normalization of sentiment, but continuing market appreciation is more likely due to ongoing improvement in the fundamentals, both economic and corporate. Given that, a reversal of the trend would require either a wholesale turnabout by investors, from confident to scared, or a significant deterioration in the economy.
Right now, there are few signs of either.


 Print
Print


