

 Print
Print The other day, we talked about the bond market and the effects of the recent sharp increase in interest rates. Although the immediate impact was real, we concluded that the adjustment was more a return to normal than something worse. In other words, nothing to worry about.
What do higher yields mean for stocks?
Amid all the commentary on the recent surge in stocks, the possible effects of higher bond yields haven’t really come up. No harm, no foul seems to be the general take. And yet, in theory, higher rates should have the same kind of negative effects on stock values that they do on fixed income investments. After all, low rates are thought to be one of the pillars supporting lofty valuations. Even though the market is going up, we should be thinking ahead to what higher rates might mean.
The best way to try and understand the future is to take a look at the past. The following chart, from J.P. Morgan’s Guide to the Markets, shows the effects of interest rate movements on the stock market.
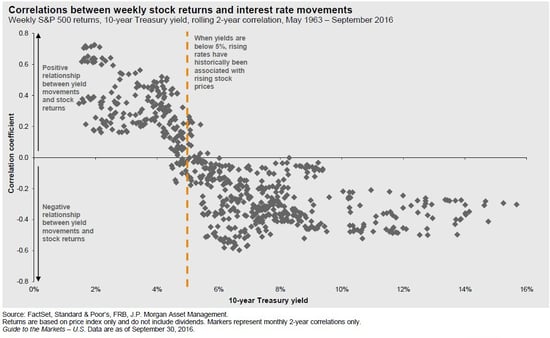
It’s a complex chart, but the conclusions are clearly summarized: “When yields are below 5 percent, rising rates have historically been associated with rising stock prices.” In other words, with rates at low levels like they were (and still are), stocks have gone up when rates did. In fact, the lower the initial rates, the more likely stocks were to rise when rates did.
Mathematically, this makes no sense, but economically, it is perfectly reasonable. When rates are at very low levels, it is because the economy is troubled and growth is low. When rates start to rise, that means conditions are getting better, which is good for companies and stocks.
For proof of this, we need only look to the Federal Reserve’s actions over the past several years, keeping rates low when growth was slow and now planning to increase them as growth accelerates. At the company and stock market level, the positive effects of faster economic growth have more than offset the negative effects of higher rates.
Rates nowhere near the risk zone
That changes, of course, as the economy overheats and rates rise. At some point (around 5 percent in the chart above), higher rates become a drag rather than a boost as economic growth slows. Right now, we’re nowhere close to that level, but it is something to watch for. Even if you assume that threshold rate is now lower—and I can make a good argument that it is—we’re still not close. Rising interest rates may remain a positive signal for the stock market for some time.
Looking at it another way, since World War II, there have been 21 pops in long-term bond yields. In 13 of those instances, stock valuations rose, and in 18 of them, the S&P 500 appreciated. The situation right now is completely consistent with that data. In the three instances that the S&P 500 declined, the rise in rates was well above what we see now.
This looks to me like more good news
The rise in bond yields since the election seems to reflect expectations of faster growth, and thus far, the market is validating that. Given those conditions, it seems reasonable to conclude that the results of higher rates this time will mirror those of the past and continue to support stock valuations.
Unlike with fixed income, where higher rates have a short-term negative and a longer-term positive effect, higher rates are a positive signal for stock markets—and should remain so for some time to come.


