

 Print
Print With everyone out shopping today, we'll soon be seeing the usual slew of Black Friday data (and the instant economic analysis that goes along with it).
The media tends to spin Black Friday sales into a narrative of how strong the holiday shopping season will be and how well the economy is doing. But should we take those reports at face value? The fact is that consumer behavior has changed over the past several years, and so has the significance of Black Friday shopping numbers.
Spending on a downward course
Let's start by looking at Black Friday numbers from the National Retail Federation, which provide a reasonable first cut.
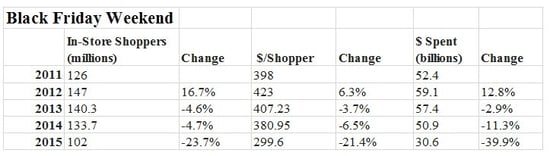
Based on this chart, the number of shoppers on Thanksgiving weekend has been dropping since 2013, with a very significant dip last year. And the amount spent per shopper has declined as well, with total sales during the Thanksgiving weekend falling by double digits over the past two years.
Now, let’s take a look at a longer data set (but one that does not include 2015), compiled from Wikipedia:
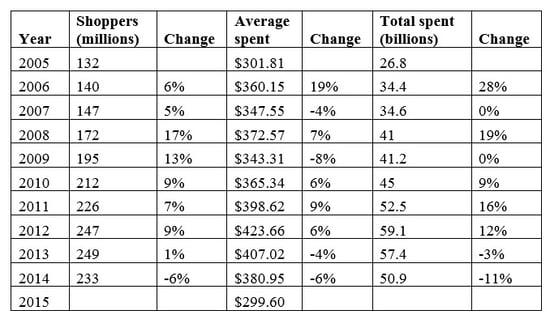
Although there are inconsistencies between the two data sets, we again see a decline in the past couple of years, against previous substantial increases.
Trend may continue, but not to worry . . .
Last year, the drop in Black Friday sales was interpreted as a sign of economic weakness, but as we now know, that wasn’t true. If past trends hold, we will probably see a further decline in Black Friday shoppers and money spent at traditional retail this year. But contrary to what the news reports may suggest, that's not necessarily reason to worry.
One reason is the rise of sales through channels outside of traditional retail. The chart below, also from Wikipedia, shows online sales on Cyber Monday:
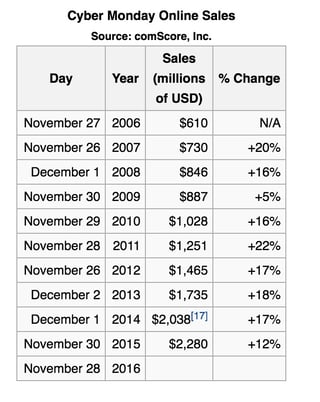
Here, we can see that online sales are rising as fast, if not faster, than traditional Black Friday sales are declining. In other words, people are still buying, but they are buying through different channels.
They are also buying different things and at different times. Black Friday sales, even through traditional channels, have been shrinking as a proportion of total holiday sales; total sales are increasing even as Black Friday sales decrease. Although Black Friday is still important, it simply isn’t as relevant as a predictor of the holiday season—and the economy—as it used to be.
A weak Black Friday won't derail the economy
We can reasonably expect Black Friday sales to drop again on a year-to-year basis, but this reflects a well-established trend of changing consumer behavior rather than sudden economic weakness. Based on the wider set of data, the economy should continue to grow, and expectations for the holiday shopping season remain solid, even if Black Friday sales disappoint.
Happy holidays, and let the shopping begin!


