The Independent Market Observer

12/27/13 Problems Get Solved – Annual Progress Report

December 27, 2013

I was reviewing the posts I made last December, and it occurred to me that many of the problems we were worrying about then have largely been solved, or at least are on their way there. I think we all have short memories and tend to look more at the now than at the recent past, so it’s worth highlighting some of the very real improvements that occurred in 2013.

The biggest relief, of course, was the successful passing of the date for the Mayan apocalypse. No doubt you were all as worried as I was about the impending end of the world, but, ultimately, my decision not to sell everything and head for the hills was vindicated. We are still here.

Continue reading → Leave a comment

10/14/13 – The Whole Thing, Explained

October 14, 2013

Over the weekend, I traded e-mails with one of our advisors, who pointed out that I hadn’t yet done a complete explanation of the situation in Washington, DC. Sure, I’d touched on various aspects of it, but I hadn’t really looked at the thing as a whole. So here’s my take. Thanks, Alex, for the great idea!

The Big Picture

Continue reading → Leave a comment

10/1/13 – Assessing the Shutdown Damage

October 1, 2013

For the first time since 1995–1996, the U.S. government has been shut down in a dispute over the federal budget. Now that it has happened, we can start to assess the damage, as well as evaluate how the dispute is likely to play out.

Before we do, there are a couple of important things to keep in mind. First, we made it through the 1995–1996 shutdown, and we will make it through this one. Second, although there will be damage, it will be limited. Just as with the sequester spending cuts, the damage will be absorbed and the economy will return to growth. This too will pass.

Continue reading → Leave a comment

9/30/13 – Here Comes the Shutdown

September 30, 2013

Here we go again. I’ve written something to that effect several times over the past couple of years, what with the 2011 debt ceiling debate, the 2012 fiscal cliff, and now this. Governmental dysfunction has been normalized.

The phrase that comes to mind is “defining deviancy down,” from a 1993 paper by Daniel Patrick Moynihan, one of the great statesmen of American politics. The idea is similar to the boiled frog theory I described last month: with every ratchet down in behavior, the new low becomes somehow normal, and any subsequent changes are perceived as being less bad (compared with the new “normal”) than they would have been otherwise. Another way to describe it is a behavioral downward spiral—that is, behavior that formerly would have been thought absolutely disgraceful is now seen as somewhat embarrassing.

Continue reading → Leave a comment

9/27/13 – The Government Shutdown, the Debt Ceiling, and the Markets

September 27, 2013

I have to be honest: I’ve been putting off writing about this for the past couple of days, for both good and bad reasons. One good reason is that, really, there hasn’t been much news. Congress is playing games, everyone is shouting at each other, and nothing is getting done. The other good reason is that there’s not much we can do to prepare, given the level of uncertainty that prevails. No news, no action items, no need to comment.

The bad reason I have for putting this off is that, quite frankly, it’s depressing. We’ve been through this before, in both 2011 and 2012, and the fact that we’re going through it once again is just ridiculous. Be that as it may, though, here we are, so let’s deal with it.

Continue reading → Leave a comment

9/24/13 – Gratitudes for America

September 24, 2013

As I mentioned yesterday, the countdown to fiscal meltdown is back on. Washington, DC, has once again formed a circular firing squad, busily loading weapons and aiming across the circle, oblivious to the fact that the guy on the other side is doing the same thing.

Continue reading → Leave a comment

9/4/13 – Data Points That Really Mean Something: Auto Sales

September 4, 2013

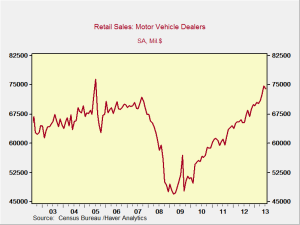
In yesterday’s post, I discussed why I think both house sales and car sales are good indicators for the economy’s performance over the next 6–12 months. I went into some detail about the housing market and why I believe it will continue to support growth; today we’ll do the same for auto sales.

To recap a bit, anyone buying a car is making a long-term commitment, as well as a long-term bet on his or her own earning power. To be willing to make the commitment is to have confidence in the future. At the same time, since most autos are bought with financing, a lender must also have confidence in the future. Rising auto sales therefore reflect both consumer and business confidence, and are based on what people are really doing at a given point in time, without much room for interpretation or adjustment.

Continue reading → Leave a comment

8/27/13 – The Boiled Frog Effect

August 27, 2013

In what I really hope is an apocryphal story, it is said that frogs don’t notice small temperature changes. You can, therefore, put a frog in a pan filled with cold water, and, as long as you heat it very slowly, you can actually boil the frog without it jumping out. If you keep the temperature changes slow enough, it will never realize that the heat is rising to harmful, and then fatal, levels.

I have, obviously, never tried this, but something similar has been happening in the U.S. economy. I am pleased to find, however, that people appear to be somewhat smarter than frogs. The heat I’m referring to is the pending debt ceiling crisis.

Continue reading → Leave a comment

7/30/13 – Why the Economy Should Get Better

July 30, 2013

We can expect the announcement of GDP growth for the second quarter to be lousy—around 1 percent or so if we’re lucky, less than that if we’re not. Why is this, and what does it say about the rest of the year?

The short answer is that we got what we asked for at the start of the year. If you remember, back then we had the fiscal cliff and a record, uncontrollable deficit. Some wanted higher taxes, others wanted reduced spending; everyone wanted a lower deficit.

Continue reading → Leave a comment

6/17/13 – An Updated Look at the Long Term

June 17, 2013

Many of my posts over the past several weeks have focused on immediate, here-and-now issues—or, at most, ones we’ll be seeing over the next couple of months. With summer here (finally!) and sunshine cheering me up, I thought I’d take another look at the medium- to long-term future—which was good the last time I looked, about two years or so ago, and which has since gotten even better.

Two years ago, when I first gave a presentation on the longer-term outlook for the U.S., I identified several key issues: capital, raw materials/resources, manufacturing, energy, geography, markets, and labor. The U.S. was in a relatively superior position compared with its competitors in all of those areas, except for capital.

Continue reading → Leave a comment

Subscribe via Email

New call-to-action
Crash-Test Investing

Hot Topics


New Call-to-action

Conversations

Archives

see all

Subscribe


Disclosure

The information on this website is intended for informational/educational purposes only and should not be construed as investment advice, a solicitation, or a recommendation to buy or sell any security or investment product. Please contact your financial professional for more information specific to your situation.

Certain sections of this commentary contain forward-looking statements that are based on our reasonable expectations, estimates, projections, and assumptions. Forward-looking statements are not guarantees of future performance and involve certain risks and uncertainties, which are difficult to predict. Past performance is not indicative of future results. Diversification does not assure a profit or protect against loss in declining markets.

The S&P 500 Index is a broad-based measurement of changes in stock market conditions based on the average performance of 500 widely held common stocks. All indices are unmanaged and investors cannot invest directly in an index.

The MSCI EAFE (Europe, Australia, Far East) Index is a free float‐adjusted market capitalization index that is designed to measure the equity market performance of developed markets, excluding the U.S. and Canada. The MSCI EAFE Index consists of 21 developed market country indices.

One basis point (bp) is equal to 1/100th of 1 percent, or 0.01 percent.

The VIX (CBOE Volatility Index) measures the market’s expectation of 30-day volatility across a wide range of S&P 500 options.

The forward price-to-earnings (P/E) ratio divides the current share price of the index by its estimated future earnings.

Third-party links are provided to you as a courtesy. We make no representation as to the completeness or accuracy of information provided on these websites. Information on such sites, including third-party links contained within, should not be construed as an endorsement or adoption by Commonwealth of any kind. You should consult with a financial advisor regarding your specific situation.

Member FINRASIPC

Please review our Terms of Use

Commonwealth Financial Network®