I was sitting on a plane home last night, watching SpongeBob with Jackson, and as I flipped through the channels, I saw that the stock market had cratered since we got on the plane. What?


I was sitting on a plane home last night, watching SpongeBob with Jackson, and as I flipped through the channels, I saw that the stock market had cratered since we got on the plane. What?
February 25, 2013
The headlines today seem to imply that the sequester will hit, as the Republicans have very little incentive to back down.
February 22, 2013
In the spirit of several previous posts, I’m taking a couple days off to take my son, Jackson, down to visit his grandparents in Florida. Among the many things I’m grateful for are that both my parents and my wife’s are healthy and active, and that Jackson has a chance to spend time with them and get to know them.
I would also like to mention the support and many thoughtful remarks, both in-person and written, I received in response to my family’s loss. One of the wonderful things about what I do—and particularly where I work, Commonwealth Financial Network—is the truly thoughtful, considerate, and wise colleagues and friends I have. These are very smart people who also really care about others and who take the time to show it. I can’t tell you how honored and grateful I am to have people like this as colleagues and friends.
February 21, 2013
The markets have had a good run for the past six weeks, with a return through Tuesday of more than 7 percent for the S&P 500 Index. The run seemed to have been predicated on the fiscal cliff deal at the end of last year, the impression that the Federal Reserve (Fed) would continue to support the economy with low interest rates, the resolution of the European debt crisis, growing corporate earnings and profits, and a real economy in steady recovery. Retail investors had started pouring money back into equities, and there was talk of a “Great Rotation” out of fixed income and back into stocks.
Well, the real economy is still in recovery, but the other pieces of the puzzle are looking ragged. Yesterday, the Fed published minutes from the most recent meeting of the Federal Open Market Committee, showing that the committee is not unified in its decision to maintain purchases of Treasury and mortgage securities. This raises the possibility that rates might increase much sooner than the market had thought. Sequestration has also moved back to the front pages of the major papers, suggesting that the political risk from Washington is rising. In addition, Europe looks to be very much in play again, as Silvio Berlusconi has a shot at the Italian elections— which could blow up the current austerity-driven political consensus—and the economy of the eurozone as a whole continues to weaken, driven primarily by France.
February 20, 2013
In the last round of the Washington budget debates—the fiscal cliff—a compromise was finally reached, whereby the Bush administration tax cuts were extended for the vast majority of the population, while taxes went up on people with incomes over $400,000 (or $450,000 for joint filers). In addition, the expiration of the payroll tax waiver raised taxes on everyone with wage income.
You probably remember this. It was only a couple of weeks ago.
February 19, 2013
I wrote several months ago about good habits and my efforts to adopt several of them. The one I’d like to focus on today is writing down daily gratitudes, a practice that experts link to increased happiness and success.
This weekend, I found out that there are other benefits as well. At 6:30 on Sunday morning, I had to put my cat, Putter, to sleep. He had been with us for 14 years, after my wife adopted him as a feral cat. He’d been there through several homes, several jobs, our marriage, and our adoption of our son, Jackson. He was part of the family.
February 15, 2013
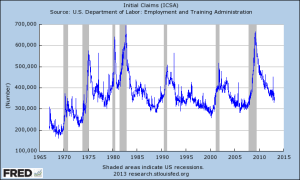
The good news keeps trickling in. New unemployment claims ticked down again, continuing a decline that is bringing us closer to the lows of the mid-2000s, as the chart below shows.

February 14, 2013
In my post on currencies a couple of days ago, in which I discussed the strength and weakness of various currencies with respect to one another, the question I left unaddressed is what determines those relative values and whether there is in fact a “right answer” as to the value of each currency.
As is common with economic questions, there are several right answers, depending on how you look at it. One way to consider the value of one currency relative to another is to look at the markets—how many yen will it take to buy a dollar? The foreign exchange, or forex, markets are among the largest in the world. When currencies are allowed to freely float, or trade at will, the markets will determine what a currency is worth. This is the most transparent and informative way to set values, as it reflects a wide, liquid market with many participants.
February 13, 2013
The story today is the President’s State of the Union address last night. He made many points, but all centered around the role of government in the economy. Implicit in his program was the presumption that government can engineer outcomes superior to what the market would create. Also implicit was the notion that government can be key to kick-starting growth. Are those presumptions right, and can the President’s proposals really start to create a better outcome?
Let’s step back a moment and consider what “growth” means. If we are looking at a pie, any way we slice it, for someone to get more, someone else has to get less. This is how much of the debate on spending and taxes has been framed so far—either we cut spending or raise taxes, because the pie is only so big.
February 12, 2013
Here in the U.S., we are pretty lucky. We transact all of our business in dollars, and it never occurs to most of us to think about other currencies until we travel outside the U.S. It just doesn’t enter into our consciousness that we should care, or need to care, about the dollar itself. Like air, we take it for granted.
But, like air, when things turn bad, we have to start paying attention pretty quickly. Again, here in the U.S. we have never really had to cope much with that problem. As the “reserve currency,” the U.S. dollar is the currency for most of world trade, and therefore everyone else has to hold dollars in one form or another if they want to trade with the U.S.—and they do. We have a built-in demand for our currency that supports its value. The benefit is that we can buy things made in other countries cheaper, in dollar terms, if the dollar is strong.


