The Independent Market Observer

Market Dominoes Keep Falling

October 26, 2018

After yesterday’s bounce, we’re seeing another bad day for the market. When I started writing this, the S&P 500 was down another 2 percent. The proximate cause here seems to be slower-than-expected revenue growth in two bellwether tech companies, Google and Amazon. They are down significantly more than the market as a whole, although the damage is widespread.

Continue reading → Leave a comment

Time to Plan for the Next Big Market Crash?

October 25, 2018

I still suspect that current market volatility will ultimately prove to be a short-lived pullback. But there is no doubt that the risks are rising. Yesterday’s drop started to show signs of what could be a break in confidence, which could lead to further losses. As such, we need to start thinking about what those losses might mean. Even if this isn’t the next big market crash, we can reasonably expect that to show up in the next couple of years. So, this line of thinking certainly isn’t wasted effort.

Continue reading → Leave a comment

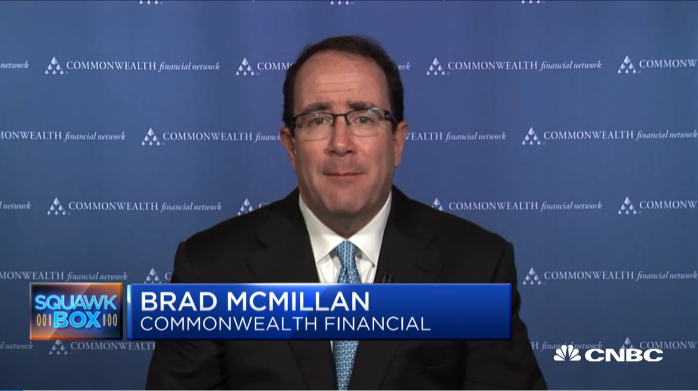
Appearance on CNBC's Power Lunch, October 24, 2018 [Video]

October 25, 2018

Yesterday, I appeared on CNBC's Power Lunch to discuss (no surprise here) market turbulence. Tune in to hear why I think we're experiencing normal noise, plus what sectors are performing well despite the current volatility.

Continue reading → Leave a comment

What Could Take the Market Back Up?

October 24, 2018

We have spent the past couple of days worrying about the market dropping. Indeed, today we have a further decline. This volatility isn’t unexpected, certainly. But the further down we go, the more worried we should be—and the more inevitable further declines look.

Continue reading → Leave a comment

Another Bad Day in the Market: Now What?

October 23, 2018

When I started writing this today, the S&P 500 was down about 2 percent (though it's come back up a bit in the past few hours), giving us another bad day in the market. Overall, we are down approximately 8 percent from the peak. Once again, concerns are rising over whether this is the big one, the repeat of 2008.

Continue reading → Leave a comment

Monday Update: Industrial Production Strong, Retail and Housing Sales Slowing

October 22, 2018

Last week was a busy one for economic news, with a wide range of data from across the economy. This week will give us a final view of housing for the month, as well as whether business investment continues to improve. We’ll also get a preliminary look at how the economy performed in the third quarter.

Continue reading → Leave a comment

Appearance on CNBC's Nightly Business Report, October 18, 2018 [Video]

October 19, 2018

Yesterday, I appeared on CNBC's Nightly Business Report (my segment begins at 4:38) to discuss the global issues weighing on the market, as well as their potential impact on U.S. investors. Listen in to learn more.

Continue reading → Leave a comment

Thinking About October 19, 1987: Black Monday

October 19, 2018

Lots of things happened in 1987. Among others, I graduated from college. But, if you are in the financial industry at all, the mention of 1987 calls only one thing to mind: Black Monday (October 19, 1987), the day the stock market crashed. In many ways, this was the biggest nightmare of many stock investors. So, it is no wonder it continues to cast such a long shadow. In light of the recent market volatility, I think it makes sense to reflect on what happened 31 years ago today and what it might mean for investors today.

Continue reading → Leave a comment

Looking Beyond U.S. Markets

October 18, 2018

I am in the process of writing my speech for Commonwealth’s National Conference in November. I have decided to focus on really understanding what is going on with the trade war and what that might mean for investing. That understanding, of course, requires a fairly deep dive into both what is happening and where the war started.

Continue reading → Leave a comment

Market Volatility: The Real Lesson

October 17, 2018

I don’t get a lot of panicked calls and e-mails when the market melts up, like it did yesterday. When the market rises 2 percent, the sense seems to be that it’s just the universe working out the way it should. But when the market drops 2 percent? Something must be out of whack! And yet, both are signaling the same thing: the markets are struggling to put a price on future uncertainty. When markets bounce around that much, it is because there is real disagreement about what the future could hold and what that means for corporate profits and, therefore, for stock prices.

Continue reading → Leave a comment

Subscribe via Email

AI_Community_Podcast_Thumb - 1


Episode 9
July 23, 2025

Episode 8
June 18, 2025

Episode 7
May 14, 2025

Episode 6
April 23, 2025

More


Hot Topics


New Call-to-action

Archives

see all

Subscribe


Disclosure

The information on this website is intended for informational/educational purposes only and should not be construed as investment advice, a solicitation, or a recommendation to buy or sell any security or investment product. Please contact your financial professional for more information specific to your situation.

Certain sections of this commentary contain forward-looking statements that are based on our reasonable expectations, estimates, projections, and assumptions. Forward-looking statements are not guarantees of future performance and involve certain risks and uncertainties, which are difficult to predict. Past performance is not indicative of future results. Diversification does not assure a profit or protect against loss in declining markets.

The S&P 500 Index is a broad-based measurement of changes in stock market conditions based on the average performance of 500 widely held common stocks. All indices are unmanaged and investors cannot invest directly in an index.

The MSCI EAFE (Europe, Australia, Far East) Index is a free float‐adjusted market capitalization index that is designed to measure the equity market performance of developed markets, excluding the U.S. and Canada. The MSCI EAFE Index consists of 21 developed market country indices.

One basis point (bp) is equal to 1/100th of 1 percent, or 0.01 percent.

The VIX (CBOE Volatility Index) measures the market’s expectation of 30-day volatility across a wide range of S&P 500 options.

The forward price-to-earnings (P/E) ratio divides the current share price of the index by its estimated future earnings.

Third-party links are provided to you as a courtesy. We make no representation as to the completeness or accuracy of information provided on these websites. Information on such sites, including third-party links contained within, should not be construed as an endorsement or adoption by Commonwealth of any kind. You should consult with a financial advisor regarding your specific situation.

Member FINRASIPC

Please review our Terms of Use

Commonwealth Financial Network®