 I concluded in yesterday’s post that there might well be a storm coming. So, the next question we need to answer is this: How will we know when the storm is about to hit?
Remember, what we are worried about here is a large, sustained drop in the stock market, otherwise known as a bear market. Before we can understand how immediate our risk is, we need to understand the conditions that might result in a bear market. To do that, we can look for common factors in past bear markets. If and when those factors occur again, we can reasonably conclude that a bear market is a real possibility.
Bear market risk factors: What to watch for
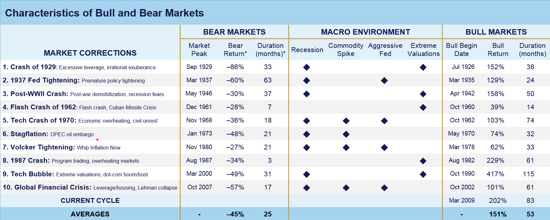
Recession. The most common factor is a recession, which occurred in eight of ten bear markets. The two bear markets where recessions didn’t occur were in 1962 and 1987. In both cases, the downturn was brief, and markets fully recovered in a year. The other eight multiyear bear markets were associated with recessions, so this is definitely a risk factor. And it makes intuitive sense, as, during a recession, company earnings—and valuations—are likely to decline.
As I said yesterday, based on the data points I track monthly, a recession is likely sometime in 2018, which would raise the market risks considerably.
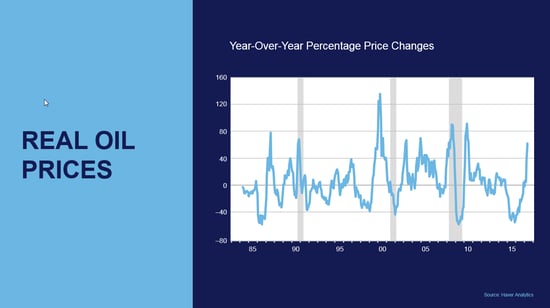
Rising commodity prices. Oil especially is another risk factor. This makes sense as well. Higher oil prices cut consumer confidence and spending power, raise business costs and cut profits, and generally slow down the economy and hurt corporate sales and profits. On a year-on-year basis, oil prices are up substantially, although they have pulled back recently.
Now, this is not to say that an increase from $25 per barrel to $50 per barrel is the same as one from $80 to $160. Of course, it is not. All the same, though, higher oil prices have at least reduced the tailwind for the markets and economy and may even have turned into a headwind.
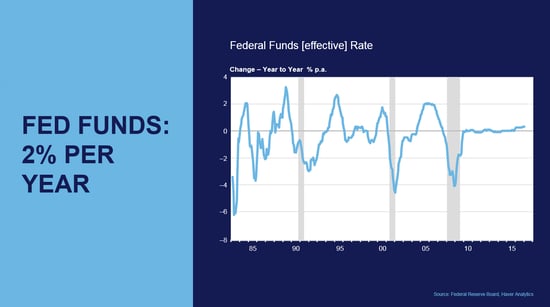
Interest rates. The third factor is rising short-term interest rates, especially if they push higher than long-term rates. When this happens, it’s typically a sign of lower growth expectations, which is bad for the stock market, and a slowing economy, which is also bad for the stock market. Looking at history, every time the Fed has started raising rates, it has ultimately done so by about 200 basis points over a one-year period. We’re in the middle of that right now, and we will hit the 200 bps threshold in 2018 at current expectations.
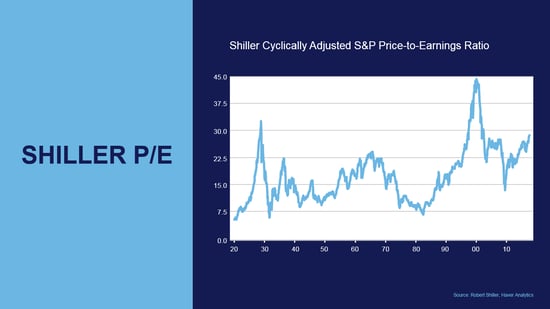
Valuations. The fourth risk factor is an expensive stock market. Think about it: you fall farther from the 10th story than you do from the 2nd. Looking at the Shiller P/E ratio, the only times stocks have been more expensive than they are now is in 1929 and 1999.
Big picture, then, all four risk factors indicate that a bear market could be a possibility sometime in the next 24 months or so. This certainly does not mean a storm will hit, but it does suggest that one might. Which brings us to the next question: How can we know when a storm is imminent?
Storm warnings
The indicator I prefer is the 200-day moving average (MA), which is simply the average of the closing prices of the stock market for the past 200 days. When the market is above that threshold, it tends to go up; when it falls below that threshold, the risk of a larger drop increases. The 400-day MA is an even better indicator, but it is less timely. Personally, I start to pay attention when the market cracks the 200-day, and I start to take action when it cracks the 400-day.
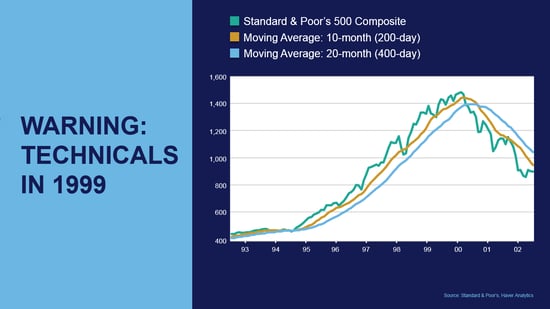
If we look at how these indicators worked in the 1990s, we can see that the 200-day MA gave us two false alarms—breaking below and then recovering—before finally signaling the top in 2000. The 400-day gave us no false alarms and also signaled a top in 2000.
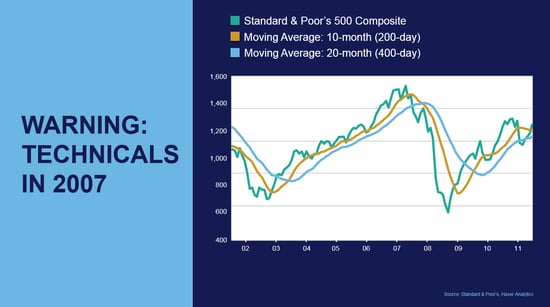
We see the same behavior in 2007. Here, the 200-day MA gave us three false alarms—and the 400-day gave none—before they both signaled the final top in 2008. Both were good guideposts about when to worry and when risk became imminent.
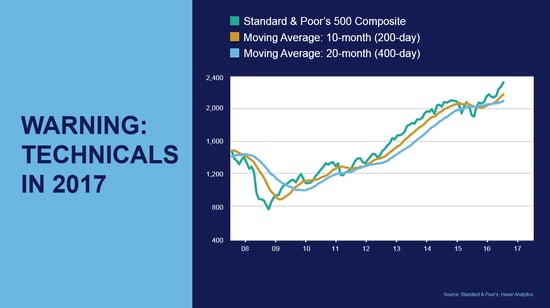
If we extend this analysis to today, we can see that, since 2009, the 200-day MA has given us four false alarms (although some of those “false alarms” were fairly sizable pullbacks). The 400-day MA has given us three false alarms. Currently, these indicators are healthy, and based on the past two major bear markets, I think they are good ways to determine when potential risk turns into immediate risk.
We can now conclude that potential risk is high, and we know the warning signs of imminent danger. Next week, we’ll look, as I often do, at why and how this analysis could be wrong. Will it be different this time? It could be, and we need to consider that. Finally, we will discuss what investors might want to do when the signals go off.
Have a great weekend!


 Print
Print

