 In yesterday’s post, we investigated whether 2017 is similar to 1999—and decided that it is. This leads us to the next obvious question: will 2018 look like 2000? And what would that actually mean? As I mentioned yesterday, we don’t know what 2018 will hold, but we do know what 2000 and subsequent years looked like. If we take the comparison between 1999 and 2017 seriously (and I think we should), we can therefore use what happened then as a guide to what might happen next.
Using economic indicators as our guide
To do so, let’s use the same economic factors we reviewed yesterday, but this time we’ll extend the data.
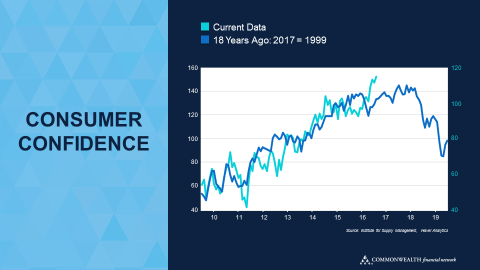
Consumer confidence, at very high levels in 1999, peaked the next year and then started to decline rapidly. If we translate that scenario into today, we would see a decline in early to mid-2018. Based on the current data, confidence does appear to be topping. Although there are no signs of a substantial decline yet, levels are certainly no longer increasing. Again, looking at the 1999–2000 data, there was a period of several months where confidence was flat at a high level, which is similar to where we might be right now.
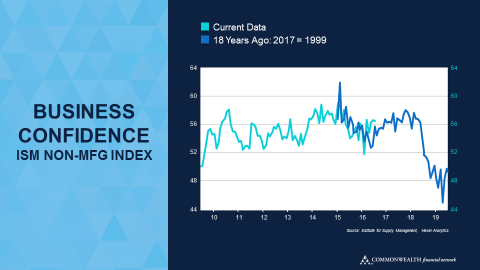
When we look at business confidence, we see the same picture. Yesterday, I used the ISM Manufacturing Index, since the non-manufacturing one didn’t go back far enough. This time, though, the Non-Manufacturing Index was useful. You can see in the chart above that the data we do have overlaps closely with the late 1990s data, further supporting the comparison. Just as with the consumer data, there are high but stable levels of confidence—like we have now—but then levels start to decline quickly in early to mid-2018.
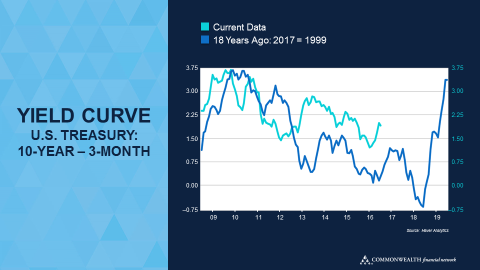
Interest rates and monetary policy show the same trend. Looking at the yield curve, the most recent data has the spread between the 10-year and 3-month rates declining right now. Although we are still outside the trouble zone, we are getting closer, especially as the Fed has again raised short-term rates. Plus, the Fed is planning to continue to raise short-term rates, and there’s no real sign that long-term rates will increase significantly. As such, we could find ourselves in the trouble zone below zero, a major signal of a recession, sometime around late 2017 to mid-2018. This would be consistent with the experience from 1999–2000.
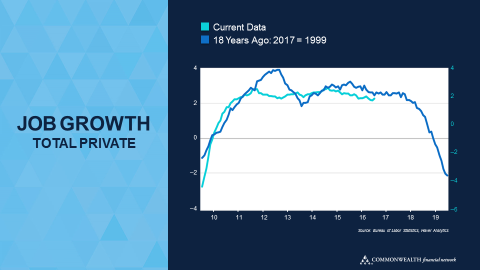
Next up is job growth. In 1999–2000, we saw continued but slowing growth, just as we do right now. But in mid-2000, which would be 2018 today, jobs went negative—a major sign of a recession.
Markets follow economy
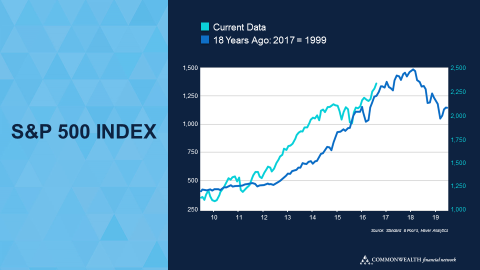 The markets, of course, tend to follow the economy, with a recession being a necessary component for an extended bear market. With all of the economic indicators moving into recessionary territory by mid- to late 2000, the stock market was rolling over at the same time. Were the comparison to hold, we might see the same happen in 2018.
None of this is guaranteed, of course. The year 1999 is not 2017, no matter how much it may resemble it, and we can’t predict the future. At the same time, though, it seems reasonable to conclude there may well be stormy weather ahead.
So, how should we prepare for the storm? Will it be next year? Maybe, maybe not. Although there may be clouds on the horizon, what we need is a set of signals that tell us the storm is on its way. That is what we will talk about tomorrow.


 Print
Print