

 Print
Print The strength (or lack thereof) of the dollar is a perennial topic here on the blog. Looking at the past several years, I see “U.S. Dollar Still Failing to Collapse” (November 2015), “Should You Be Worried About the Strong Dollar?” (December 2016), and, after a bit of a hiatus, “The Dollar Is Not Collapsing” (July 2020). There are many other versions, of course. (Notably, I did a whole series on money and the dollar back in 2013.) But the message has consistently been this: exchange rates bounce up and down, but there is no reason to worry.
That’s not to say we should not keep an eye on things, of course. Per the “Parable of the Turkey,” we can’t assume that because nothing has gone wrong, that nothing can go wrong. And, since I am starting to get questions again, now seems to be a good time to take another look.
The Pandemic and the Dollar
Let’s start with the past two years, which captures the entirety of the pandemic. In the chart below, we can see the dollar rallied at the start, but it has since slumped. It recently dropped again to the lowest point of the pandemic. This is what is generating the concern—the fact that, for months now, the trend has been significantly down. Should we be worried?
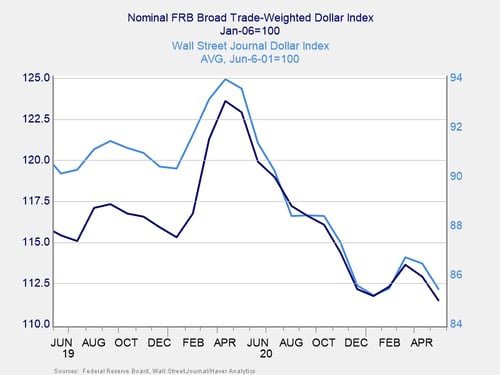
To help answer that question, let’s make the chart a bit more representative. Note below that the decline for both the Federal Reserve Board (FRB) and Wall Street Journal (WSJ) lines are both less than 10 percent. The way the axes are set, it looks much worse than that.
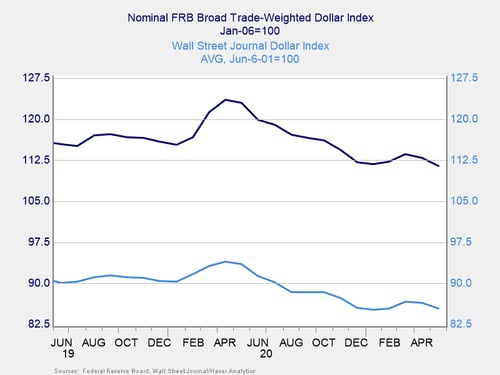
In fact, if we reset the scale on the graph, using exactly the same data, that change looks even smaller (see below). If we were to set the scale to show the full 0-128 range, it would look even smaller. In other words, even using this short time frame, while the decline is real, the magnitude is much smaller than most of the charts in the media would suggest. And, at the proper scale, it is self-evidently not something to panic about.
The Long View
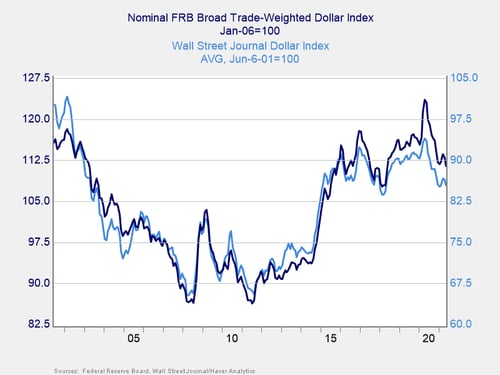
Just as rescaling the data on the basis of magnitude puts the relatively small decline into perspective, so too does rescaling it on a longer time period. If we take the period from the past 2 years to the past 20 years, we see a few things. First, the rally at the start of the pandemic was typical given the rising risk around the world, and the pullback on decreasing risk is reasonable on that basis alone. As the conditions that led to the spike (i.e., the pandemic) abate, so should the spike itself, which is what we see happening. Second, as that spike abates, the dollar is now at the level where it has spent most of the past 5 years. In other words, rather than a decline to worry about, this is just a return to normal. Third, rather than collapsing, the dollar is actually quite strong and still at high levels compared with the past 20 years.
A Normal Response
In fact, if you look at the bigger picture, the dollar tends to spike during times of trouble, then drift back down. It happened in 2000, it happened in 2008, it happened in 2016, and it is happening now. We might see more of a downtrend, and that would actually be a good thing. As other economies around the world recover, we should see their currencies become more attractive, and the dollar should trend down in response. This is a normal response to a normalizing global economy.
Yes, the dollar is trending down—and it could go lower. But that’s a good thing. And one more time: the dollar is not collapsing.


