Print
Print My colleague Sam Millette, senior investment research analyst on Commonwealth’s Investment Management and Research team, has helped me put together this month’s Market Risk Update. Thanks for the assist, Sam!
This month’s risk update is coming a bit later than usual. Given the substantial declines we have already seen in March, we have used this space to respond to investor concerns. In any event, it became fairly obvious that risk was elevated as markets continued to drop.
Elevated risk remains the case, given the declines we have already seen. The risk of further declines is also substantial. That risk, however, seems to be more focused on rising fear and the likelihood of the virus spreading even faster than on the economic and market fundamentals, many of which remain in yellow light territory. Market risk is now at red, and deservedly so. But the fact that several risk factors are not at red suggests that, for the moment at least, there are mitigating factors. We should keep these in mind as we navigate through the current bear market.
As was the case at the end of January, the last week in February saw a risk-off sentiment driven by the continued global spread of the coronavirus. Markets initially shrugged off January’s volatility and set new all-time highs by mid-February. But concerns about the impact of the coronavirus continued to drive additional volatility at month-end, leading to the worst week for the market since 2008. This volatility has continued into March, as countries and businesses take additional steps to combat the spread of the coronavirus, and U.S. markets have since moved into the first bear market in a decade. We’ll continue to monitor this situation closely; however, there are several key factors that matter for the market in determining the overall risk level.
Recession risk
Recessions are strongly associated with market drawdowns. Indeed, 8 of 10 bear markets have occurred during recessions. As we discussed in this month’s Economic Risk Factor Update, right now the conditions that historically have signaled a potential recession are not yet in place. There are, however, signs that risks are out there, with the inversion of the 10-year and 3-month yield curve throughout the month highlighting such risks. On an absolute basis, most of the major signals are not yet in a high-risk zone, and February’s data releases largely came in better than expected. With that being said, all five of the major economic signals are still at a yellow light. As such, we have kept economic factors at a yellow light for March.
Economic shock risk
There are two major systemic factors—the price of oil and the price of money (better known as interest rates)—that drive the economy and the financial markets, and they have a proven ability to derail them. Both have been causal factors in previous bear markets and warrant close attention.
The price of oil. Typically, oil prices cause disruption when they spike. This is a warning sign of both a recession and a bear market.
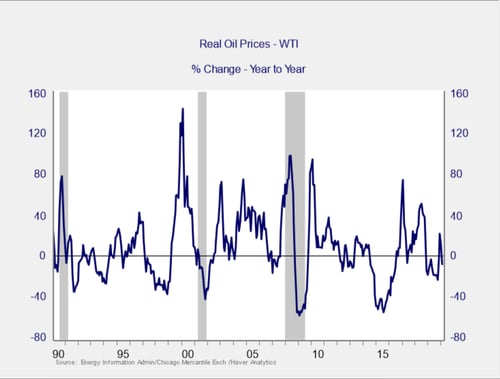
The price of oil fell by roughly 8 percent on a year-over-year basis in February. This decline breaks a streak of two consecutive months with rising oil prices. It also brought the price of oil to $50.53 during the month, down from the $57.53 we saw in January. This marks the lowest monthly price we’ve seen since December 2018. Since then, of course, prices have dropped even further. Prices were affected by the coronavirus, which weakened global demand for oil during the month and, more recently, by the Saudi-Russia price war. Given the drop in the price of oil during the month, we’ll leave this indicator as a green light for now.
Signal: Green light
The price of money. We cover interest rates in the economic update, but they warrant a look here as well.
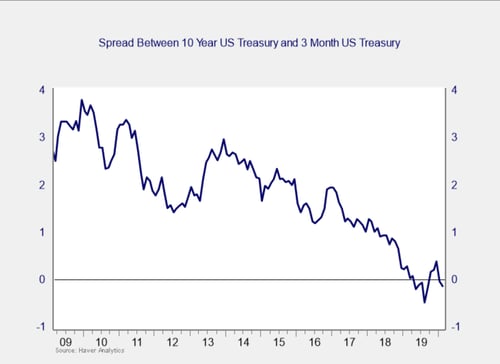
After spending the fourth quarter un-inverted, the yield curve re-inverted in January and remained inverted throughout February. As was the case in January, the inversion was driven by falling long-term yields. The yield on the 10-year Treasury note fell from 1.54 percent at the end of January to 1.13 percent at month-end, and it has since fallen even further. The fall in long-term rates was driven by investor concerns about the spread of the coronavirus and the resulting flight to safety. The risk of a recession in the future still remains, as historically we’ve seen recessions follow un-inversions of the yield curve within 12 months. We are keeping this measure at a yellow light for this month, with a potential move to red on the horizon if this inversion continues.
Signal: Yellow light (with a hint of red)
Market risk
Beyond the economy, we can also learn quite a bit by examining the market itself. For our purposes, two things are important:
- To recognize what factors signal high risk
- To try to determine when those factors signal that risk has become an immediate, rather than theoretical, concern
Risk factor #1: Valuation levels. When it comes to assessing valuations, we find longer-term metrics—particularly the cyclically adjusted Shiller P/E ratio, which looks at average earnings over the past 10 years—to be the most useful in determining overall risk.
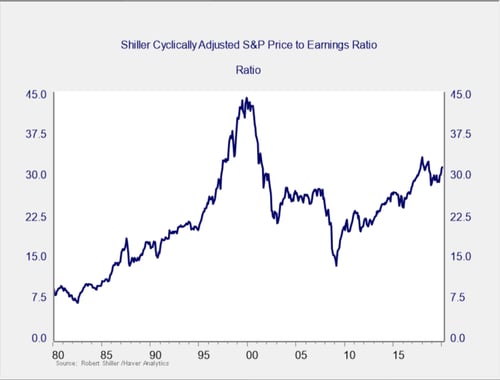
The major takeaway from this chart is that, with the run-up in 2019, valuations remain extremely high. They are still above the levels of the mid-2000s, although down from recent highs. Despite the drop, stocks remain quite expensive based on history. High valuations are associated with higher market risk—and longer-term metrics have more predictive power. So, this is definitely a sign of high risk levels.
Even as the Shiller P/E ratio is a good risk indicator, however, it is a terrible timing indicator. To get a better sense of immediate risk, we can turn to the 10-month change in valuations. Looking at changes, rather than absolute levels, gives a sense of the immediate risk level, as turning points often coincide with changes in market trends.
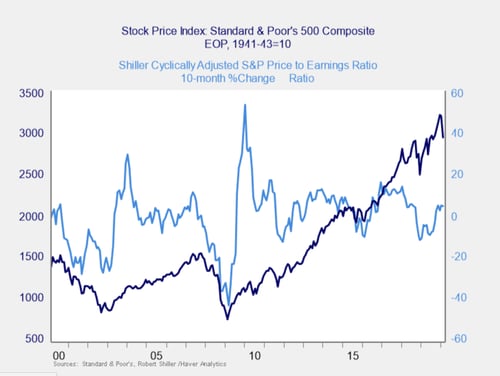
Here, you can see that when valuations roll over, with the change dropping below zero over a 10-month or 200-day period, the market itself typically drops shortly thereafter. Markets started off February strong, hitting all-time highs here in the U.S. by midmonth. Fears over the spread of the coronavirus and the potential impact on global growth led to a global flight to safety trade at month-end that roiled global equity markets. Markets have continued to show volatility in March. We are keeping this indicator at yellow due to the fact that it has not yet shown significant declines and remains above the levels of 2011 and 2015–2016.
Signal: Yellow light
Risk factor #2: Margin debt. Another indicator of potential trouble is margin debt.
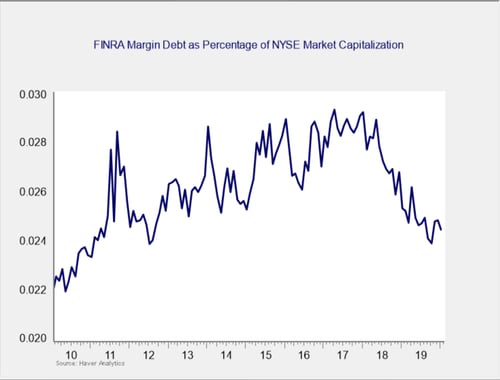
Debt levels as a percentage of market capitalization have dropped substantially over the past two years, to close to the lowest levels of the recovery. Margin debt remains at the low end of recent history, but it remains high by historical standards. The overall high levels of debt are concerning; however, as noted above, high risk is not immediate risk.
For immediate risk, changes in margin debt over a longer period are a better indicator than the level of that debt. Consistent with this, if we look at the change over time, spikes in debt levels typically precede a drawdown. Margin debt as a percentage of market cap is well below highs seen in 2017 and 2018 and continued to fall throughout much of 2019.
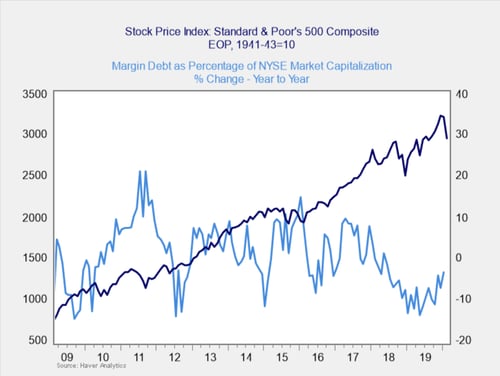
As you can see in the chart above, the annual change in debt as a percentage of market capitalization remains below zero, despite the uptick to start the year. This indicator is not signaling immediate risk at this point but has been volatile in recent months. Given that, and the fact that the overall debt level remains high historically, it is worth watching. So, we are keeping this indicator at a yellow light.
Signal: Yellow light
Risk factor #3: Technical factors. A good way to track overall market trends is to review the current level versus recent performance. Two metrics we follow are the 200- and 400-day moving averages. We start to pay attention when a market breaks through its 200-day average, and a break through the 400-day often signals further trouble ahead.
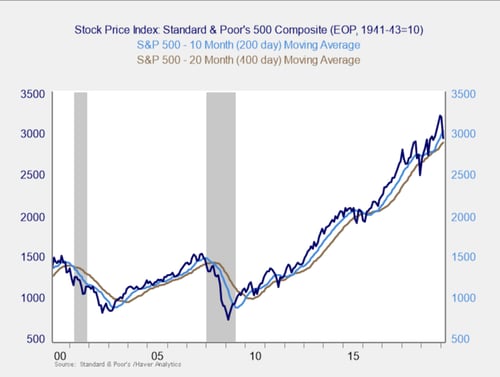
The decline at the end of the month brought both the S&P 500 and the Dow Jones Industrial Average below their respective 200-day trend lines, which is a significant support level. The Nasdaq Composite was the only major U.S. equity market that was able to end the month above trend, although it did briefly break below this level on the final trading day of the month before recovering. Since then, of course, all indices have broken through not only their 200-day trend lines but also their 400-day trend lines.
The 200-day trend line is an important technical signal that is widely followed by market participants, as prolonged breaks below this trend line could indicate a longer-term shift in investor sentiment for an index. The 400-day trend line is also a reliable indicator of a change in trend. As we’ve seen to start March, the continued downturn has broken both, indicating that market volatility is likely to continue in the short term. We’ve downgraded this signal to a red light given the important technical levels that have been breached.
Signal: Red light
Conclusion: Market risks high, based on recent trends
Fundamentals have been improving, with better-than-expected results for some of the most closely watched economic updates that were released in February, and the market risk factors remain in general at the yellow light level. But we are now changing the risk level to red as the recent declines appear to reflect an exogenous shock: the coronavirus pandemic and its associated panic.
The recent technical breakdown in the indices is being driven not by fundamental factors but, rather, by fear around the spread of the coronavirus. As such, we cannot assume that the recent volatility we’ve experienced will follow the same swift bounce pattern we observed in previous pullbacks, and we have assigned greater weight to the market behavior indicators than to the fundamentals. Recent behavior, with market uncertainty created from the spread of the coronavirus, is likely to continue until the virus has been brought under control.
As such, we are dropping the overall market risk indicator to a red light. This is not a sign that end times are here for markets. Instead, it is a recognition that markets have begun to more fully price in the impact from the coronavirus spread and that the uncertainty created by the situation will likely lead to more short-term volatility. Hopefully, that volatility will be constrained by the fact that many fundamentals are not as negative, but the risk is real.