Print
PrintMy colleague Sam Millette, senior investment research analyst on Commonwealth’s Investment Management and Research team, has helped me put together this month’s Economic Risk Factor Update. Thanks for the assist, Sam!
The economic data released in February largely came in better than expected. Improvements to service sector confidence and the better-than-expected February jobs report were highlights. But the yield curve remained inverted for the second month in a row, as investors reacted to the global spread of the coronavirus with a flight to safety that depressed long-term bond yields. Ultimately, while much of this data will likely be pressured by concerns surrounding the coronavirus in the upcoming months, February’s data releases painted a picture of an improving economy that was poised for accelerated growth.
The Service Sector
Signal: Yellow light
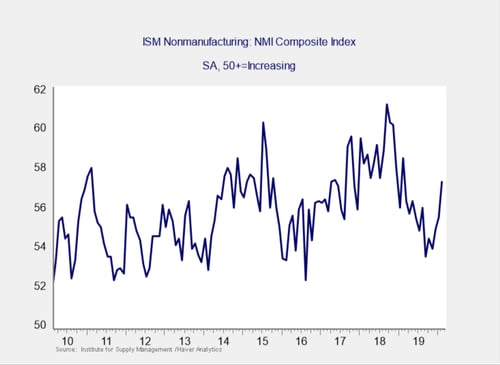
This measure of service sector confidence continued to improve in February, increasing from 55.5 in January to 57.3 in February. This result was better than economist estimates for a move down to 54.8. This is a diffusion index, where values above 50 indicate expansion. So, this improvement is a positive development and indicates that businesses did not panic over the coronavirus headlines during the month. Further, improving business confidence typically supports additional business investment, which was weak throughout much of 2019. As such, this better-than-expected result was very encouraging. Despite the improvement we’ve seen over the past few months, service sector confidence still sits below recent highs seen in 2018, and we can reasonably expect that the coronavirus will serve as a headwind for future confidence. So, we are keeping this signal at a yellow light for now.
Private Employment: Annual Change
Signal: Yellow light
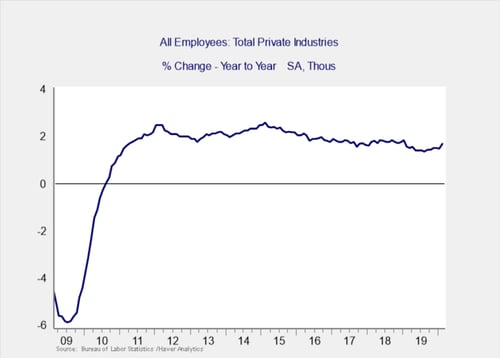
February’s employment report came in much better than anticipated, with 273,000 new jobs added against expectations for 175,000. This result matches January’s upwardly revised 273,000 new jobs, marking the best back-to-back result for new job growth since the summer of 2016. The six-month moving average of new job growth now sits at a four-year high. This positive result was driven by a surge in construction and hospitality hiring, which were in turn helped by the warmer-than-average weather during the month. We moved this indicator to a yellow light four months ago. While results have been impressive since, we’ll wait to see how employers respond to the headwind created by the coronavirus before considering an upgrade to green.
Private Employment: Monthly Change
Signal: Yellow light
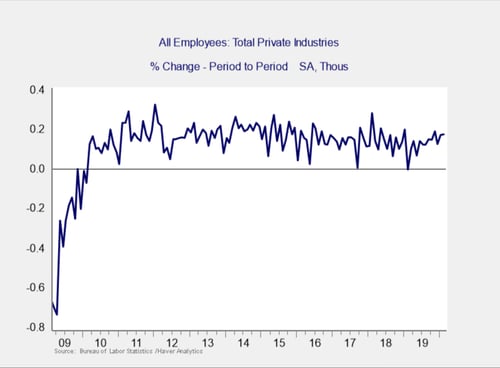
These are the same numbers as in the previous chart but on a month-to-month basis, which can provide a better short-term signal.
The pace of month-over-month job growth picked up in February, rising by the second-fastest monthly rate in more than a year. The headline jobs figure came in better than expected, and the underlying data was positive as well. The unemployment rate decreased from 3.6 percent in January to 3.5 percent in February, which ties a postrecession low. The better-than-expected results to start the year indicate that the acceleration in new job creation we saw at the end of 2019 continued into the new year. Given the strong headline job creation, we will leave this indicator at a yellow, with an eye on changing to green if we see further improvements despite the headwind created by the coronavirus.
Yield Curve (10-Year Minus 3-Month Treasury Rates)
Signal: Yellow light
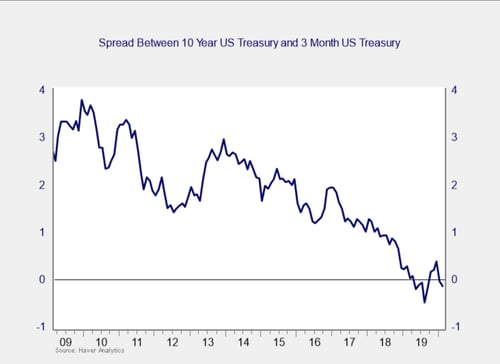
After spending the fourth quarter un-inverted, the yield curve re-inverted in January and remained inverted throughout February. As was the case in January, the inversion was driven by falling long-term yields. The yield on the 10-year Treasury note fell from 1.54 percent at the end of January to 1.13 percent at month-end. The fall in long-term rates was driven by investor concerns about the spread of the coronavirus and the resulting flight to safety we saw at month’s end. The risk of a recession in the future still remains, as historically we’ve seen recessions follow un-inversions of the yield curve within 12 months. We are keeping this measure at a yellow light for this month, with a potential move to red on the horizon if this inversion continues.
Consumer Confidence: Annual Change
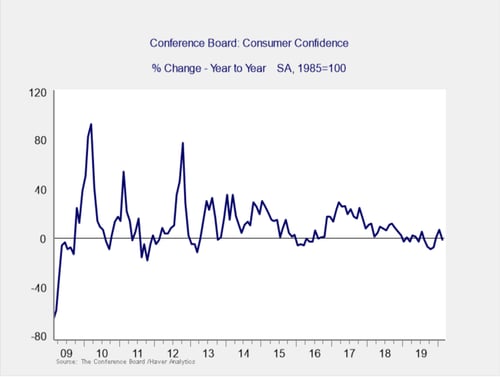
Signal: Yellow light
Consumer confidence increased modestly from a downwardly revised 130.4 in January up to 130.7 in February, against expectations for an increase to 132.2. While this moderate increase looks solid at first glance, it actually represents a slight decline from January’s initial estimate of 131.6. Despite January’s negative revision, February’s result still represents impressively resilient consumer confidence given the negative news coverage from the continued spread of the coronavirus that dominated headlines at month-end. Looking forward, we’ll see if the recent sell-off has a measured impact on consumer confidence in March; however, for the time being, this is a solid result for the index. We’ll continue to leave this indicator at a yellow light for now, but we will be paying close attention to consumer confidence given the escalating nature of the situation and the important relationship between consumer confidence and spending growth.
Conclusion: Risk remains elevated
February’s data releases largely came in better than expected and showed that the economy was on solid footing to start the year. Given the fundamentals, we expect growth to continue at a muted pace as we move into 2020; however, the coronavirus could certainly have a larger impact than initially believed. Despite the headwind from the continued spread of the coronavirus, the better-than-expected jobs report and business confidence figures helped calm concerns of a sharp decline in confidence and economic activity during the month. Improved business confidence is also a potential tailwind for future growth, as it could lead to additional business investment, which was lacking in 2019.
Despite these improvements on a monthly basis, the year-on-year trends indicate that risks remain. Although continued slow growth remains the most likely case based on the data, the chances of a recession within the next 12 months cannot be dismissed, as seen by the re-inversion of the yield curve and the pressure from the spread of the coronavirus. Right now, however, slow growth is not a recession, even as the bulk of the data indicates the risks of further slowdown remain possible. As such, we are leaving the overall risk level at a yellow light for the economy as a whole for March.