

 Print
Print So, let’s get back to the labor market discussion we started last week. Today, I want to take a deeper look at the key assumptions we referenced the other day, specifically that there will end up being more workers than jobs. As we discussed then, this has been the case for decades. But, in recent years, that dynamic has been changing as employment rose to new highs and unemployment dropped to multi-decade lows.
Over time, there seem to have been fewer workers available for the available jobs, and that has been what has driven real wage growth higher. Post-pandemic, we have seen that trend spike as we discussed in the last post. The question we have to ask is whether that spike—and/or that trend—will continue.
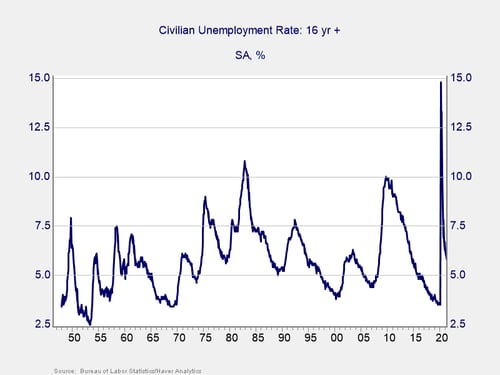
Unemployment Rate
You can see that trend below. Pre-pandemic, the labor market was at the tightest level in the past 50 years, as measured by the unemployment rate, since mid-1968 at the height of the Vietnam War. This was despite the slow growth we saw for much of the post-financial crisis period. With jobless rates that low, pretty much everyone who wanted a job had one. In fact, the unemployment rate pre-pandemic was below what economists had thought was the minimal frictional rate.
Jobs Available per Unemployed Person
The unemployment rate is a useful indicator and covers a long time period. But another and in some ways more intuitive way to look at this is to take the number of job openings and divide by the number of unemployed to get the jobs available per unemployed person. The data goes back less than 25 years, but what it does cover is instructive. In the boom times of 2000, there were 75 jobs for 100 unemployed people. In 2007, we got back to that same level at the peak of the boom.
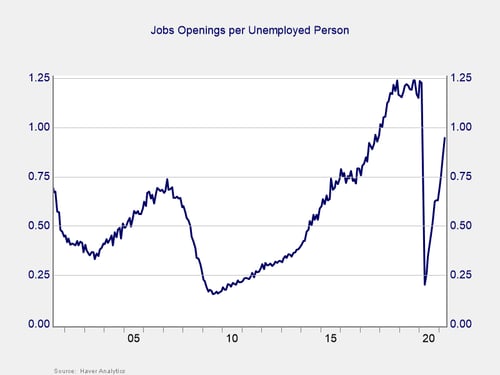
Then, of course, it collapsed again, but we then got back to that level in 2015. Instead of rolling over at that point, it kept going up to 125 jobs per 100 people, before the collapse in the pandemic. Pre-pandemic, there were more jobs available per unemployed person than there were at the peak of either the dot-com or housing booms. Something looked to have changed. And, looking at the same numbers now, there are already more than 75 jobs per 100 people available, well above the prior boom level peaks. Since we are still in the recovery period, not at a boom peak, this means something has changed.
What’s Changed?
To figure that out, we have two data points to look at. The number of jobs has increased substantially, or the number of unemployed people has dropped substantially, or most likely it is a combination of both. So let’s look at the data for both.
As you might expect, there is an inverse relationship. When times are good, job openings are high and the number of unemployed is low, which makes sense. Note, however, that over the past couple of decades, the number of unemployed people has stayed roughly constant, while the number of job openings has trended up. The economy has continued to grow, while the number of available workers—workers who need a job and are motivated to take one almost regardless of pay—has stayed roughly constant. The number of jobs has kept growing, while the number of available workers has not. And that gives us a significant clue as to what is going on.
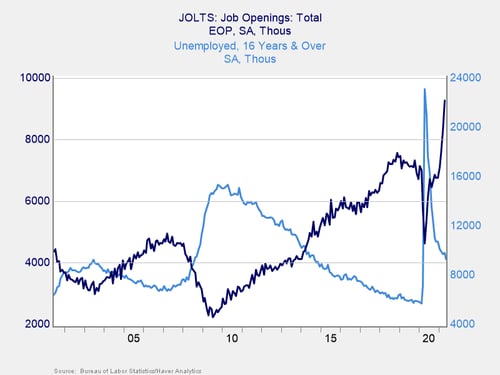
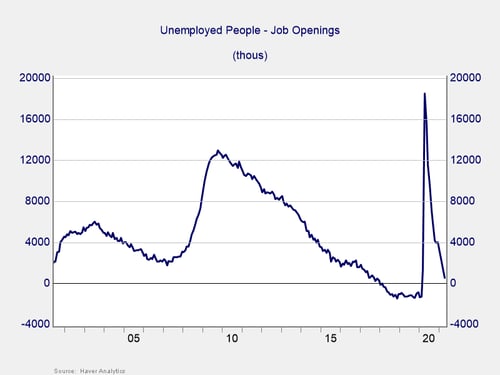
We can get a more intuitive look at this by focusing on the number of excess workers in the economy (i.e., the unemployed in excess of available jobs). Up until about 2017, there were indeed a significant number of excess workers, typically in the millions. Starting about 2018, though, the available employees moved from surplus to deficit. While that number spiked during the pandemic, it has now moved back below all previous levels and is closing in on another deficit. Again, even as we recover, we are close to out of workers. No wonder employers are finding it hard to hire.
Now, this is not to say the workers are not available. As I have written, there are millions of people not in the labor force who are now willing to work, as wages rise. Labor is a market, and supply responds to price. So, some or all of them will move back to employment over the next year or so. Even if all of them do, however, that still leaves the labor market very tight. And even if all of them do, it still leaves a long-term trend that will keep it tightening.
That trend is the result of demographics, with the labor force growing more slowly than the economy. In the next post, we will take a look at that, as well as some of the factors that have pushed the “not in the labor force” contingent higher in the past decade. Those trends are well-founded and likely to continue. At the same time, however, we will also consider the shock versus trend effect, and note that the recent changes are likely to moderate somewhat going forward.
The Bottom Line
The labor market will not be loosening significantly over the next couple of years, and we will have to deal with that. But, as markets adjust, the recent tightening is likely to soften, giving us more time to adjust than the most recent number would suggest. More details tomorrow.


