

 Print
Print At the start of 2020, I did a piece on inflation versus wage growth where I looked at a bunch of different indicators. The short version of that post is that, for working people, wage growth had generally been higher than inflation over the preceding five years or so.
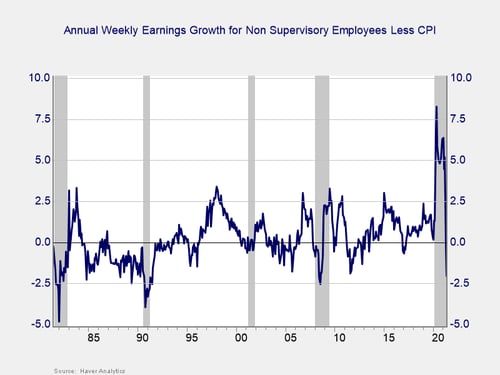
Without reinventing the wheel on what I did before, the chart below is a summary and distillation of that analysis. Here, I take the annual weekly income for nonsupervisory employees, which removes the highest-income tranches of the labor force, and subtract the year-on-year increase in the Consumer Price Index. If the number is above zero, wages went up by more than prices, for a real gain in purchasing power for the average worker, and vice versa.
What’s Trending?
Looking at the data, we can see several trends. First, in the 1980s, inflation was higher than wage gains, which we know and which means workers suffered. Moving into the 1990s and 2000s, wage growth was, on average, close to inflation, with the exception of boom periods such as the late 1990s and mid-2000s. So, on average, workers kept even or gained a bit. Since the financial crisis, however, with a couple of exceptions, wage growth has been above inflation—sometimes significantly so—to workers’ benefit. There are three different regimes here.
1980s. During the 1980s, inflation was high. But the economy was also much more unionized, and workers, in theory, had more bargaining power. And yet real purchasing power still went down significantly for a multiyear period. Clearly, workers as a group did not have the leverage to even keep their purchasing power stable.
1990s-2000s. In the 1990s–2000s, workers could, by and large, keep their wage growth consistent with inflation, with periods of above-inflation gains when the labor market got tight. Clearly, over this time period, workers as a group had more leverage.
Post-financial crisis. Finally, we reach the post-financial crisis period of the past decade or so. After the recovery started, wage gains ran consistently above price inflation, despite anemic growth over that time period. Again, it certainly looks like workers, as a group, had more leverage during that time period than during the previous ones.
Now, part of this equation is certainly that the absolute levels of inflation have declined over that time period. In theory, this decline makes it easier for companies to offer wages that exceed inflation. But at the same time, in high-inflation periods, the incentive of employees to push for higher wages is much higher. So, I don’t think that is the primary driver here. There must be something else going on.
As I said yesterday, the labor market is just that—a market—where supply (of workers) and demand (of jobs) interact to set aggregate wage income. Given that, demographics is at least a contributor to this trend of increased worker leverage and very likely the primary driver. We’re not just talking about the demographics here in the U.S., although those play a part. We need to also include the availability of workers elsewhere in the world.
Will Workers Remain Scarce?
If demographics are indeed the main driver of the trend of increased worker leverage, we have the data to figure that out—as all the individuals who will be working for the next 20 years or so have already been born. Looking at that data, the trend still has a way to go and might in fact get even more pronounced as baby boomers finish retiring, immigration stays low, and globalization eases or even reverses. A reduced supply of workers, both here and abroad, will make a scarce resource more expensive. We will take a look at that issue in more detail next.


