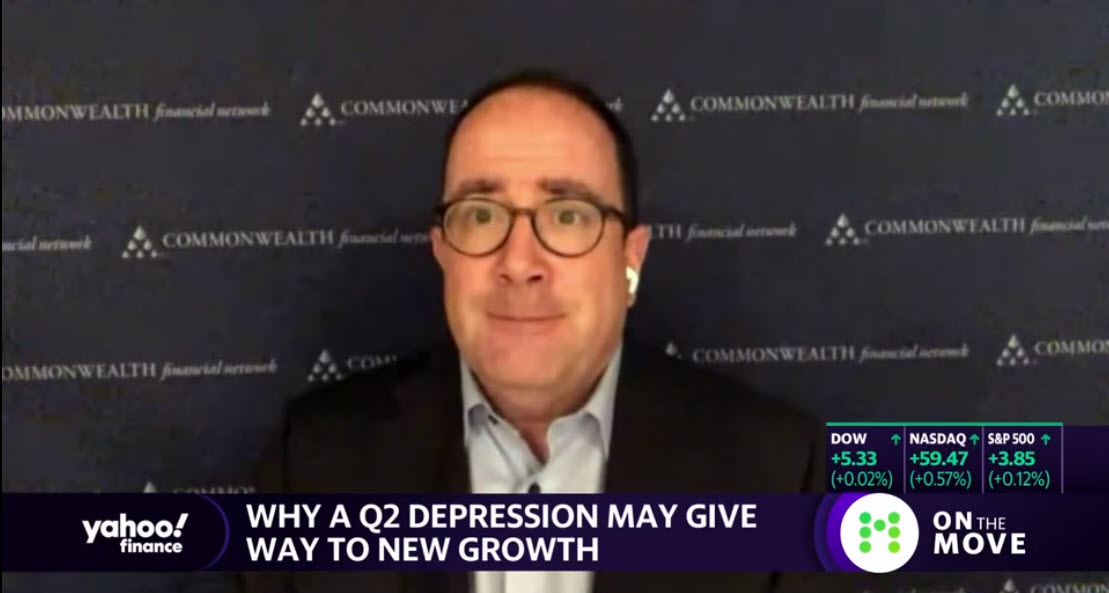
How can a second quarter depression lead to new growth? I discussed this and more today on Yahoo Finance’s On the Move.
What is the investor focus for the remainder of 2020? I discussed this and more today on Nasdaq’s Trade Talks.
June was a mixed month. The national reopening in May and June led to new viral outbreaks and a spike in new infections in multiple states. Surprisingly, though, both the economic recovery and financial markets did very well. As we enter July, the question of many minds is whether the medical situation will improve—and whether the good economic and market news will continue.
July 3, 2020
The bad news this past week is that the medical risks are still rising. Outbreaks in several states, notably Arizona, California, Florida, and Texas, have continued to get worse. All have shown significant spikes in cases in recent days, and health care capacity is becoming a concern in some cities. Multiple other states have also seen expanded case growth, although not yet at the levels of those four. At the national level, as of July 1, the number of new cases broke above 50,000 for the first time, and the daily spread rate is now approaching 2 percent per day. Similarly, even as the number of tests continues to rise, the positive rate is also increasing. The breadth and magnitude of the outbreaks continue to increase the risk at a national level.
July 2, 2020
Today, I'd like to discuss the coronavirus, including its effects on the economy and markets. Over the past week, we had some bad news on the pandemic front. There were growing viral outbreaks in several states, and the national number of new cases broke the 50,000 per day level for the first time. Although the risks are certainly rising, the appropriate measures are being taken, and we can reasonably expect the outbreaks to peak and start to decline in the next couple of weeks.
July 1, 2020
June was a great month for the markets. In part, markets were reacting to progress on the viral front, with drops in the daily case growth rate and increased testing. They were also responding to the continued economic recovery. Millions of jobs returned, and consumer confidence bounced back. Of course, there were setbacks, with some states seeing an uptick in virus cases.
June 30, 2020
Right now, we seem to be seeing a disconnect between the rising case counts and the rising stock market. Yes, there was a bit of a pullback on the news that case growth was hitting a new high. But since then, the markets have started to bounce again, even as case counts continue to increase. I get many questions about this disconnect. Indeed, on the surface, it seems to make no sense. What is going on here?
June 26, 2020
Today, I'd like to discuss the coronavirus, including the economic and market implications. We’ve had some setbacks on the pandemic front this week, with notable outbreaks in Arizona, California, Florida, and Texas. Although we’re not yet seeing a national second wave, the risks are rising. Both the daily spread rate (now at 1.6 percent per day) and daily case growth (about 40,000 per day) have jumped from last week, in large part due to the four outbreak states. Despite this concerning medical news, the economic news was good. Layoffs continued to decline, while hiring continued to improve. Plus, with metrics like consumer confidence, consumer spending, and housing all showing signs of improvement, it appears the overall recovery remains well on track.
The bad news this past week is that the chances of a national second wave of infections are increasing as localized outbreaks in several states continue to get worse. The states in question are Arizona, California, Florida, and Texas, with the Carolinas also under pressure. All have shown significant spikes in cases in recent days. Multiple other states are also seeing expanded case growth, although not yet at the levels of those four. While the virus remains under control in many states, the breadth and magnitude of the outbreaks continue to increase the risk at a national level.
June 23, 2020
COVID-19 case growth has spiked up recently in several states, taking the national case growth rate up above 30,000 per day for three of the past four days. So, do we have a second wave on our hands? And if so, what does that mean?
Guide to Long-Term Investment Strategies
MoneyGeek, 10/11/24
Bloomberg Intelligence, Israel Talks, China Markets
Bloomberg Intelligence Podcast, 10/8/24
Wall Street Breakfast: Payrolls In Focus
Seeking Alpha, 10/4/24
Q2 2024 Earnings Season Review: Beating Expectations Isn’t Enough
Advisor Perspectives, 9/12/24
2 reasons why markets will face ‘constrained volatility’ ahead [video]
Yahoo! Finance, 9/9/24
The information on this website is intended for informational/educational purposes only and should not be construed as investment advice, a solicitation, or a recommendation to buy or sell any security or investment product. Please contact your financial professional for more information specific to your situation.
Certain sections of this commentary contain forward-looking statements that are based on our reasonable expectations, estimates, projections, and assumptions. Forward-looking statements are not guarantees of future performance and involve certain risks and uncertainties, which are difficult to predict. Past performance is not indicative of future results. Diversification does not assure a profit or protect against loss in declining markets.
The S&P 500 Index is a broad-based measurement of changes in stock market conditions based on the average performance of 500 widely held common stocks. All indices are unmanaged and investors cannot invest directly in an index.
The MSCI EAFE (Europe, Australia, Far East) Index is a free float‐adjusted market capitalization index that is designed to measure the equity market performance of developed markets, excluding the U.S. and Canada. The MSCI EAFE Index consists of 21 developed market country indices.
One basis point (bp) is equal to 1/100th of 1 percent, or 0.01 percent.
The VIX (CBOE Volatility Index) measures the market’s expectation of 30-day volatility across a wide range of S&P 500 options.
The forward price-to-earnings (P/E) ratio divides the current share price of the index by its estimated future earnings.
Third-party links are provided to you as a courtesy. We make no representation as to the completeness or accuracy of information provided on these websites. Information on such sites, including third-party links contained within, should not be construed as an endorsement or adoption by Commonwealth of any kind. You should consult with a financial advisor regarding your specific situation.
Member FINRA, SIPC
Please review our Terms of Use.
Commonwealth Financial Network®