Print
PrintMy colleague Sam Millette, senior investment research analyst on Commonwealth’s Investment Management and Research team, has helped me put together this month’s Economic Risk Factor Update. Thanks for the assist, Sam!
June saw a strong rebound in many of the economic factors that we track in this piece, with results largely coming in better than expected during the month. These positive results as reopening efforts took hold throughout the country in May and June indicate that the initial pace of economic recovery was likely faster than originally expected. Some of the notable highlights include significantly better-than-expected improvements for service sector confidence and the June employment report. While the data releases in June were encouraging, we still have a long way to go to get back to pre-pandemic activity levels, and risks to the economic recovery remain that should be monitored.
The Service Sector
Signal: Yellow light
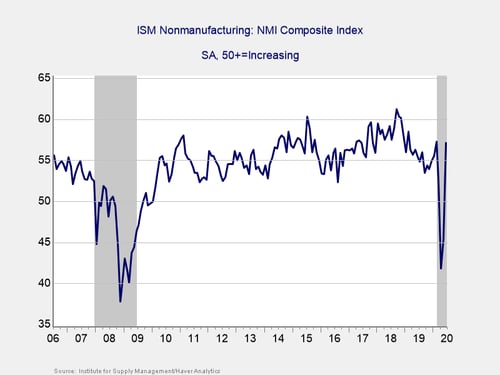
This measure of service sector confidence far surpassed economist estimates. It increased from 45.5 in May to 57.1 in June, against calls for a more modest increase to 50.2. This is a diffusion index, where values above 50 indicate expansion. So, this swift rebound back above 50 after hitting a 10-year low of 41.8 in April is very encouraging. The service sector accounts for the lion’s share of economic activity, so the rapid recovery in confidence we saw in June was a good sign for the ongoing economic recovery.
Reopening efforts in May and June served as a tailwind for service sector confidence during the month; however, there is some concern that rising case numbers could lead to a slowdown in reopening efforts that, in turn, could negatively affect confidence going forward. But given the significantly better-than-expected increase during the month, we have upgraded this signal to a yellow light for the time being.
Private Employment: Annual Change
Signal: Red light
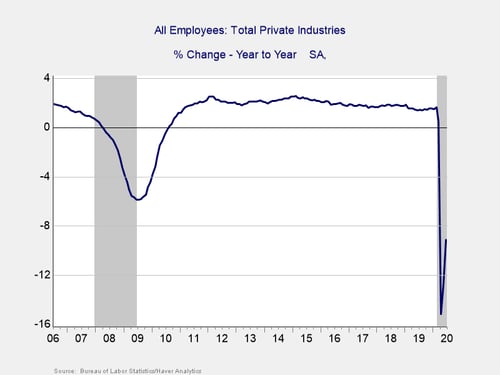
June’s employment report came in far above expectations, with 4.8 million jobs added during the month against economist forecasts for roughly 3.2 million new jobs. This marks the second month in a row where job creation came in above expectations, indicating the reopening efforts led to a faster-than-expected surge in hiring and economic activity. The unemployment rate fell to 11.1 percent in June, down from 13.3 percent in May and better than economist expectations for 12.5 percent.
This strong report, following May’s better-than-expected result, indicates that the worst of the damage to the job market may be behind us. With that being said, the damage caused in March and April still leaves overall employment levels far below where we were a year ago, and we will need several more months with similar very strong job creation to get back to pre-pandemic levels. Despite the positive results over the past two months, we’ve kept this indicator at a red light for now given the fact that overall employment levels are still extremely weak on a year-over-year basis.
Private Employment: Monthly Change
Signal: Red light
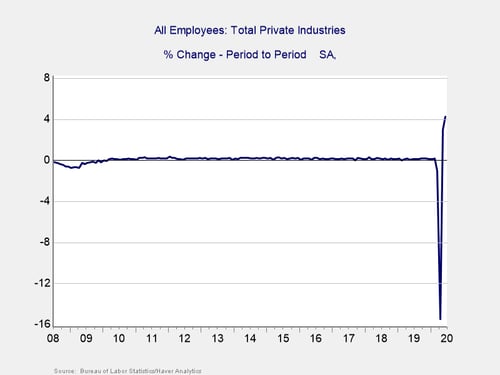
These are the same numbers as in the previous chart but on a month-to-month basis, which can provide a better short-term signal. While June’s better-than-expected report was positive, the report needs to be taken in context, as we lost more than 20 million jobs in April. Additionally, the unemployment rate of 11.1 percent in June still represents the third-highest level since World War II, trailing only April’s and May’s record results. Given the massive disruption to the job market in March and April and the still historically high unemployment rate, we are leaving this indicator at a red light.
Yield Curve (10-Year Minus 3-Month Treasury Rates)
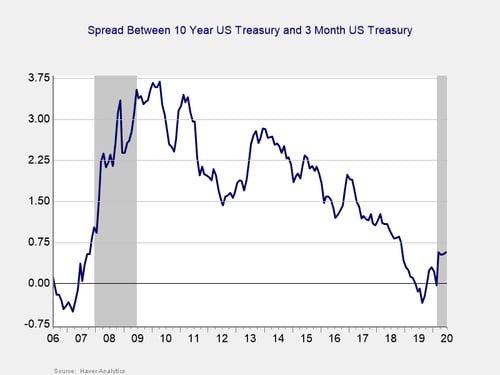
Signal: Red light
After spending the fourth quarter un-inverted, the yield curve re-inverted in January, remained inverted throughout February, and un-inverted again in March, where it has remained throughout the pandemic. This un-inversion was driven by a sharp drop in short-term rates, which in turn was caused by the Fed’s decision to cut the federal funds rate to effectively zero percent in March. The yield on the 3-month Treasury remained largely range bound in June, rising modestly from 0.14 percent at the end of May to 0.16 percent at the end of June. The 10-year yield also increased modestly during the month, up from 0.65 percent to 0.66 percent.
While an inversion is a good signal of a pending recession, it is when the gap subsequently approaches 75 bps or more that a recession is likely. We finished June with a spread of 52 bps, and the National Bureau of Economic Research (NBER) declared a recession started in February. In light of that, and with the spread remaining near the critical level, we are leaving this indicator at a red light.
Consumer Confidence: Annual Change
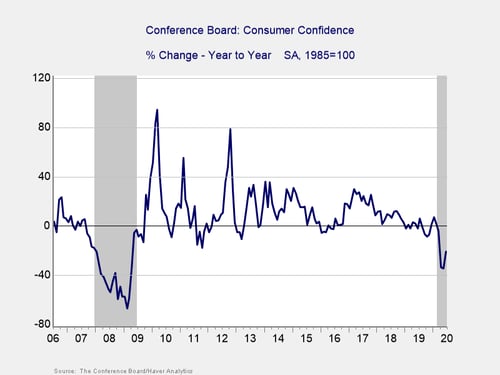
Signal: Red light
Consumer confidence increased by more than expected during the month. It rose from a downwardly revised 85.9 in May to 98.1 in June, against an anticipated increase to 91.5. This result, which marked the best single-month increase for the index since 2011, helped calm concerns about rising COVID-19 case counts negatively affecting consumer confidence. Encouragingly, both major measures of consumer sentiment increased in both May and June, indicating that April’s terrible results are likely the low-water mark for these surveys.
Despite the continued improvement in June, on a year-over-year basis, consumer confidence is still down a concerning 21 percent. Confidence declines of 20 percent or more over the past year are typically signals of a recession, which is consistent with the NBER declaration. Given the continued weakness on a year-over-year level, we have left this indicator as a red light for now, with an upgrade to yellow possible if July’s data shows continued improvements on a monthly and annual basis.
Conclusion: Economy in recession, but signs of faster-than-expected recovery
June’s economic data releases largely came in better than expected and painted a picture of a swiftly improving economy. Despite the better-than-expected results, there are still potential risks that must be monitored. The rise in coronavirus cases in June led some states to slow or, in certain cases, even rollback reopening efforts. These measures will likely help slow further outbreaks; however, they risk slowing the economic recovery. There are also other risks to watch out for, including rising trade tensions between the U.S. and China, as well as growing social unrest here at home.
Ultimately, while June showed the economy continuing on the path of recovery after setting an apparent bottom in April, there is still a long way to go to get back to pre-pandemic levels, and setbacks are likely as we go. Given the continued low levels of economic activity and the damage that was caused in April and March, we are leaving the overall risk level at a red light for the economy as a whole for July.