

 Print
Print This week’s coronavirus update is pretty much the same as last week’s. The medical risks are still rising. Outbreaks in several states (notably, Arizona, California, Florida, and Texas) have continued to get worse. All have shown significant spikes in cases in recent days, and health care capacity is now a concern in some cities. Further, multiple other states are also seeing expanded case growth, although not yet at the levels of those four. At the national level, as of July 9, the number of new cases broke above 60,000 for the first time, and the daily spread rate is now at 2 percent per day. Similarly, even as the number of tests continues to rise, the positive rate is also increasing. The breadth and magnitude of the outbreaks continue to increase the risk at a national level.
So far, however, most of the increase is still coming from a handful of states, while much of the country still has the virus under control. The four states most affected—Texas, Florida, Arizona, and California—reported 32,269 new cases, which was more than half of the total for the country as a whole. This indicates the increases in the rest of the country, while real, are much less than the headline numbers would suggest.
More, the increasingly severe outbreaks in those states and others have led them to reimpose social distancing and other restrictions. These measures should help constrain further increases. This will take time, but it should also be helped as the public starts to modify its behavior. We’re seeing the same playbook that was used in New York, and it can be expected to be effective in these states as well. But this containment will take several weeks, and we can expect to see the numbers continue to worsen until then.
Overall, the national risks are rising, and the headline numbers are increasingly alarming. Still, the base case remains that these outbreaks continue to be localized and will be brought under control before they require another national shutdown. While risks are increasing at the national level, as of now, the outbreaks are still primarily local problems.
While the medical news has been mixed, there has been some good news. The economic reopening is still on track as consumers move back into the economy, and the financial markets are responding to the economic news more than the medical news. Let’s take a look at the details.
Pandemic growth higher—but still not exploding
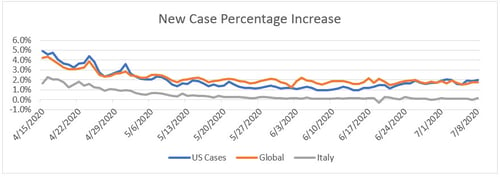
Growth rate. Over the past week, the daily case growth rate has stayed steady at around 2 percent per day, suggesting that even as the case count continues to get worse, the spread rate may be stabilizing. At this rate, the case-doubling period has remained at just over five weeks. This rate leaves the infection curve fairly flat at a national level, although several states are now showing substantially higher growth rates that could threaten their health care systems. This is a rising risk in those states.
Source: Data from worldometer.com
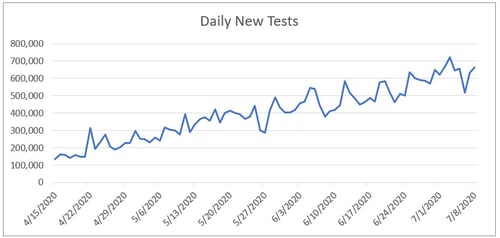
Daily testing rate. Despite the rise in infections, testing rates have not increased nearly as much. They are now at around 650,000 per day, roughly steady over the past week. This is still not yet at the level needed to develop a full understanding of the pandemic, despite the outbreaks in multiple states.
Source: Data from the COVID Tracking Project
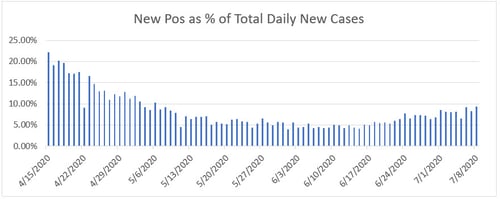
Positive test results. We can see this lack of progress by the positive rate on tests. If we look at the percentage of each day’s tests that are positive, lower numbers are better, as we want to be testing everyone and not just those who are obviously sick. The World Health Organization recommends a target of 5 percent or lower; the lower this number gets, the wider the testing is getting. Here, we can see that the positive level has started to trend up, suggesting that we are getting back to the point of just testing the people who are sick. Again, this is likely due to the effects of the state-level outbreaks.
Source: Data from the COVID Tracking Project
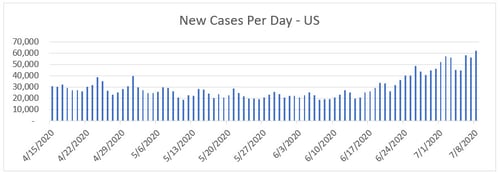
New cases per day. The most obvious metric for tracking the virus is daily new cases. Due to the state-level outbreaks, the number of new cases per day has edged up to just over 60,000 per day—the highest point for the pandemic thus far and well above the range of the past several weeks. This number is somewhat better than it looks at a national level, as it includes the effects of the outbreak states. As noted earlier, the new cases are largely from the outbreak states, although the rest of the country has also shown increases in several states.
Source: Data from worldometer.com
Total active cases. Active case growth has also ticked up over the past week and continues to move above the prior peak. New infections are now outpacing recoveries, indicating that the burden on the health care system is getting worse.
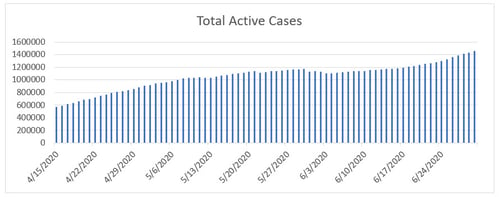
Source: Data from worldometer.com
Overall, the pandemic continues to be moderate at the national level. But major state outbreaks have risen to the level of threatening local health care systems, and case growth in other states is picking up. While the risk of a national shutdown remains small, the increasing breadth and speed of the state-level outbreaks are something we need to watch closely.
Economic reopening continues but may be showing weakness
Job market. The economic news is better, with the recovery continuing. The most recent jobs report showed that, for the second month in a row, job creation was strong, with 4.8 million jobs added in June. Layoffs continued to decline, as did the continuing unemployment claims. The big news from the jobs report is not just the jobs added but the validation that the renewed hiring is an ongoing trend and not just a one-off from last month. As this report represents actual payrolls, it is a solid indicator that the job market is now improving. We also see this improvement in many other indicators. Consumer confidence bounced back up. And, unsurprisingly with the improvements in jobs and confidence, consumer spending also continues to recover.
Consumers on the move. While the monthly numbers remain strong, the higher-frequency data is starting to show signs of weakness. The chart below illustrates higher-frequency spending data. It shows consumer spending is down by 9 percent from January, which is worse than the 8.5 percent decline last week. While this result still represents substantial recovery from the nadir, and we do see a bit of a bounce in the past day or so, it may be an early sign that consumer demand is being affected by the recent outbreaks.
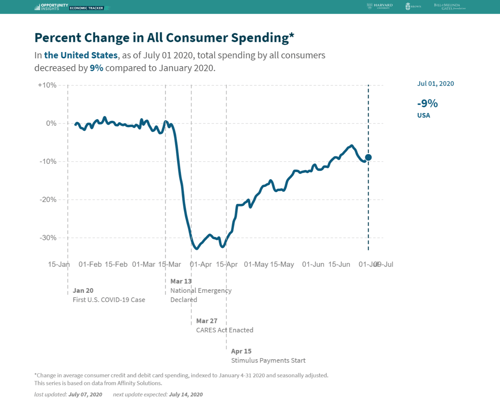
Source: tracktherecovery.org
Finally, we can see similar signs that the recovery may be slowing a bit in this composite of many indicators from J. P. Morgan, which shows the substantial recovery in many metrics with recent signs of slowing in some.
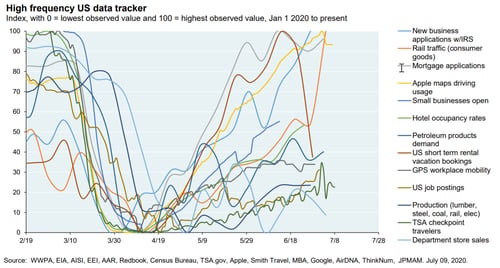
Source: J. P. Morgan
The risks. Although the reopening is going better than expected and is clearly having some positive economic effects, we certainly face risks. The biggest of these is if the local outbreaks turn into local shutdowns, which would have negative economic effects, or, even worse, into a national shutdown. At this point, that is not the most likely case, but it is an increasing possibility.
Another potential risk is that, even with the reopening, consumers will be slow to return and spending growth will not return to what was normal any time soon. So far, this has not happened, but some of the high-frequency economic data is showing some weakening. That said, we have not yet seen a decline in spending due to the outbreaks, so the hard data remains positive.
Continued volatility in financial markets on pandemic news
For the financial markets, we continue to see volatility around fears of local outbreaks going national, but markets remain supported by the ongoing positive economic news. Overall, while risks remain, the good news is that as we get more data, markets could end up with a much firmer foundation. While the medical news has been showing rising risks, so far the economic data has been positive on the whole, and markets have responded.
Recovery at risk?
The real takeaway from this past week is that the virus continues to be the major risk. If the outbreaks continue to worsen and spread, it could put the recovery at risk. There are some signs of that, but so far it has not happened. The most likely case appears to be continued recovery, despite the rising medical and economic risks.
Also supporting that idea is the fact that states with outbreaks are starting to take the necessary measures to control the outbreaks. While we will certainly see more damage, the playbook to bring the outbreaks under control was well established earlier in the pandemic and just needs to be implemented. As states do so, we could see the outbreaks subside.
Risks are rising, and we are not yet out of the woods. There are certainly significant risks going forward, with localized outbreaks turning into a national second wave being the most significant. At the same time, in some sense this situation was inevitable and just part of a necessary process to figure out how to reopen effectively while still keeping the virus under control. Even as we go through that learning process (with the consequent pain), the thing to keep in mind is that many of the biggest risks are still moving behind us.


