The only major report last week was Friday’s release of the University of Michigan Consumer Sentiment Index. It remained essentially stable, with a small decline from 94.7 to 94.3.


The only major report last week was Friday’s release of the University of Michigan Consumer Sentiment Index. It remained essentially stable, with a small decline from 94.7 to 94.3.

June 10, 2016
On June 23, Britain will vote on whether or not to leave the European Union, popularly known as Brexit (British exit). As the date approaches, concerns have been rising that the referendum might actually pass. What would it mean if it did?
June 9, 2016
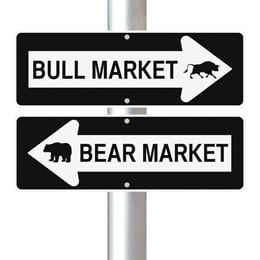
Over the last several posts, we’ve taken an in-depth look at bear markets—the factors that cause them, the events that indicate immediate risk is rising, and the time frames over which these events can develop. At the moment, the pieces don’t seem to be in place for a bear market, but the risk level does remain high.

June 8, 2016
This will be the penultimate post in our series on how to spot pending bear markets.
Although expensive valuations are a noted risk factor in past bear markets, they don’t give us much to go on timing-wise, as markets can stay expensive (or get much more expensive) for years and years.
June 7, 2016
Last week, we talked about several major warning signs for a bear market: recessions, commodity price spikes, rapid rate increases by the Federal Reserve, and high market valuations. In Friday’s Economic Risk Factor Update, we looked at the probability of a recession in the near future and concluded that it was unlikely.
Today, we’ll consider the next two risk factors: oil price spikes and Fed rate increases.
Last week’s data was more mixed than in recent weeks, with a very weak employment report and worse-than-expected results in the service sector offsetting continued positive news on manufacturing and consumer income and spending.

June 3, 2016
In yesterday’s post, we concluded that a recession is the biggest and most consequential indicator of a bear market. The next obvious question is, how can we spot a recession coming?
June 3, 2016
After an early pullback, improving economic news helped fuel a rally in U.S. indices at the end of May. While manufacturing remains a concern, improvements in consumer spending and housing have boosted confidence, prompting the Fed to suggest that the economy has normalized. Internationally, political risks continue to be a factor. And any bad news could well rattle the markets. What can we expect moving forward?

June 2, 2016
Yesterday we discussed what not to worry about, so today let’s take a look at what we, as investors, should be worrying about. In short, that would be a long-lived, substantial decline in the stock market—otherwise known as a bear market.
June 1, 2016
I’ve been giving a presentation recently, developed during the worst of the first-quarter stock market pullback, that discusses what we, as investors, should worry about and why. It may seem obvious, but in fact, most people tend to focus on the wrong things.


