

 Print
Print Over the last several posts, we’ve taken an in-depth look at bear markets—the factors that cause them, the events that indicate immediate risk is rising, and the time frames over which these events can develop. At the moment, the pieces don’t seem to be in place for a bear market, but the risk level does remain high.
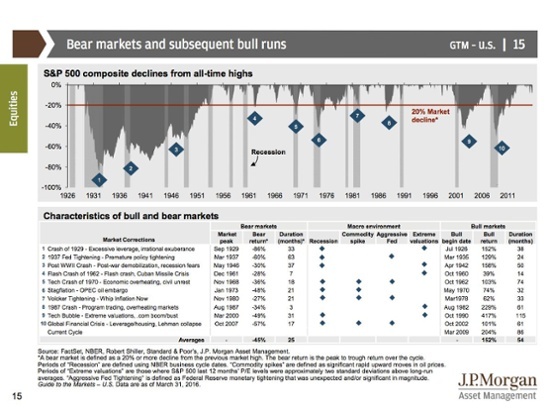
The risk framework we’ve been discussing is based on the chart below from J.P. Morgan, which shows that:
- 8 of the past 10 bear markets were associated with recessions.
- 4 of the 10 were associated with commodity price spikes, the Fed raising interest rates, or both.
- 5 of the 10 were preceded by excessive valuation levels.
I used this framework in the first quarter to argue that the pullback we saw then wasn’t the big one. As it turns out, I was right, which suggests this may be a valid approach. On the other hand, it also shows that we can have considerable, scary drawdowns that don’t meet the criteria for a bear market.
Crisis bears vs. confidence bears
For example, while eight of the last ten bear markets coincided with recessions, two (in 1962 and 1987) did not. What can we learn from them? Looking at recent significant drawdowns, we have two 19-percent pullbacks, just shy of a formal bear market, in 1998 and 2011. What does that tell us?
In both 1962 and 1987, the only risk factor present of the four we have identified was high market valuations. In 1998 and 2011, we see the same thing. In all four cases, there was a significant drawdown, without any of the fundamental economic factors in play. What happened?
I would argue that high valuations, which were in place during all of these events, reflected very high levels of investor confidence. Indeed, investors must have been feeling good in order to pay as much for stocks as they did. Therefore, a collapse in prices, in the absence of decay in the economic fundamentals, must have reflected a collapse in confidence. That's why I refer to these as confidence bear markets, rather than crisis bear markets, which are driven by economic fundamentals.
Duration makes all the difference
On the surface, looking at the drawdowns, this seems like a distinction without a difference. Who cares? The reason it matters is that the duration of the drawdown varies significantly. This is the difference between a scary drawdown and one that does permanent damage.
Quicker recovery from confidence bears. Looking at the two confidence bear markets (1962 and 1987), it took them only 7 months and 3 months, respectively, to exit bear market status per the J.P. Morgan chart, for an average of 5 months. To return to new highs took 15 months in 1962 and 23 months in 1987, for an average of 19 months. For the 1998 and 2011 pullbacks, it took 5 months and 9 months, respectively, to reach new highs. Looking at all four, the average time to recover to new highs was 13 months. Confidence bear markets can be sharp, but they have historically passed relatively quickly. Again, this is just what we saw earlier this year.
Crisis bear markets, on the other hand, took more than 30 months to even exit the bear market phase, per J.P. Morgan, and almost five years (57.5 months) to recover to new highs, on average. (That number excludes the Great Depression pullbacks.) The 1929 crash never did recover to new highs before the 1937 crash, and the 1937 crash took 110 months to recover—almost 10 years.
A confidence bear market, then, can be ridden out. Maybe not easily, but at least with some expectation that within a year or two, the market may bounce back if confidence recovers. With a crisis bear market, there is no such comfort.
Keeping a close eye on the risks
What investors really need to worry about are the crisis bear markets, the real portfolio killers. Keeping an eye on general risk levels is important, and they are currently high. Keeping an eye out for inciting events is also crucial, and that is just what I try to do with my regular updates on economic and market risks.
We can’t guarantee success, of course, but trying to prevent known sources of failure is an excellent first step. With the risk factors lining up over the next couple of years, the possibility of a crisis bear market in the not-too-distant future remains very real. Getting outside the framework, the kind of shocks that could set off such a drawdown are legion: China, Europe, oil, the list goes on and on.
Now is not the time to panic. Even if a bear market arrives, the right thing for many investors to do may well be nothing. Whatever decision you make, though, it's better to make it from a position of knowledge and forethought than out of surprise. That’s exactly why I am paying attention.


