

 Print
Print Last week, we talked about several major warning signs for a bear market: recessions, commodity price spikes, rapid rate increases by the Federal Reserve, and high market valuations. In Friday’s Economic Risk Factor Update, we looked at the probability of a recession in the near future and concluded that it was unlikely.
Today, we’ll consider the next two risk factors: oil price spikes and Fed rate increases.
Oil prices may signal increased risk over next two years
Looking at the last 10-year period, oil started out at around $50 per barrel, climbed to more than $130, dropped to below $30, and is now back to around $50. For all the hue and cry, we’re close to where we started.
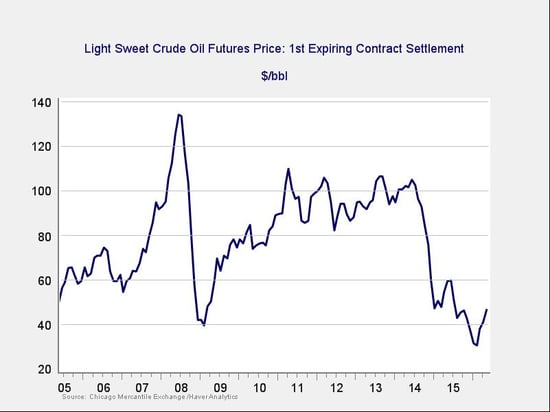
This isn’t the full story, of course. Ten years is a fairly short time frame, and the chart doesn’t account for inflation. So let’s back out inflation and extend the time frame, as follows:
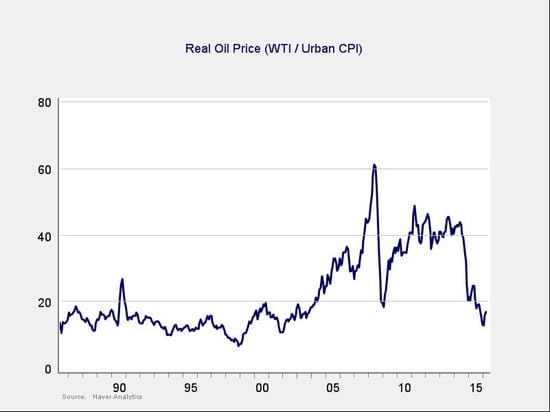
Here, we can see that, apart from the run-up in the past 10 years, today’s oil prices are quite consistent with the range over the last 30 years. In this context, current prices actually seem kind of normal, which means historical experience over that time frame should be reasonably useful. With this in mind, we can evaluate the chance of price spikes over the next couple of years.
The first step is to look at previous spikes. As you can see, year-on-year spikes of over about 50 percent have been good indicators of a recession in the next couple of years.
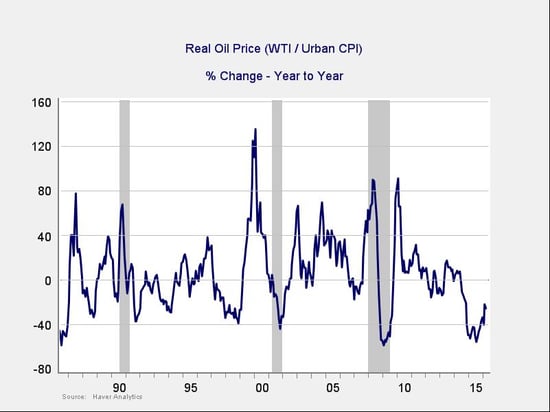
This isn’t infallible, of course—consider the spikes in 1999 and the early 2000s—but it’s a pretty good indicator. In both of those instances, however, there were bubbles in play (either in the stock market or housing) that helped keep the economy going despite the spike—and we do not have that support right now.
We also need to take a more detailed look at time frames. Based on previous sharp downturns in the late 1980s, 1990s, and 2009, it typically takes about two years to move from a decline to a spike. The current drop and recovery in prices roughly seems to be following previous events, and if it continues to do so, could indicate an increase in risk over the same two-year time frame.
Fed rate risk could sneak up on us
In light of how slow the Fed has been to raise rates, as well as the recent bad employment news (which is likely to postpone a rate hike even further), it may seem premature to worry about this. Yet, when the Fed finally does get going, it tends to move aggressively, as we can see in the following chart.
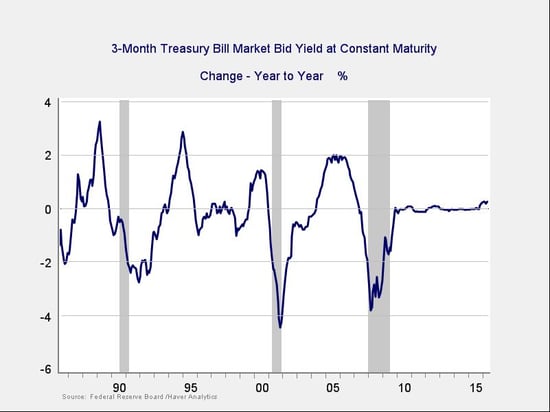
Looking at short-term rates, as set by the Fed, we see that typical increases over a period of a year, once they get going, have been at a level of 2 percent or more. The market is now debating whether the Fed will increase rates at all this year (much less two or three times), but history shows that once it starts, it’s likely to move more rapidly than the market is now pricing in.
Given the trend of a 2-percent increase over one year, and assuming the Fed starts raising rates in 6 to 12 months, we may end up seeing rates that, historically, have started to worry markets in about two years or so. (Note also that rate hikes don’t tend to end at 2 percent; the total increase is more.)
But remember, risk factors aren’t predictions
Based on this analysis, both of these risk factors could rise to material levels in around two years or so, at about the same time a recession seems likely. Just as with the recession factors, however, these potential bear market risk factors are just that. You can make good arguments against both. For instance, oil prices are likely to stay in a relatively low range given changed market dynamics, and the Fed is very likely to keep rates low and hike much more slowly than in the past. I get it, I really do.
At the same time, to assert that this time is different is a classic mistake in investing, even if in many respects it is. Considering the very real possibility that these risk factors could show up again, I will continue to watch them.
You can also argue that the timing is speculative, and I would agree with that. In this context, two years probably means something between 12 and 48 months. Again, the point is that risks will be increasing over the next year and more, and we need to keep an eye on them.
Next up, valuations
Tomorrow, in the context of my Monthly Market Risk Update, we’ll analyze the final (and arguably most important) risk factor, an expensive market. Although the other factors speak to fundamentals of the economy, valuations are different in that they reflect a simple reality: falling out of a tenth-floor window will hurt more than falling out of a first-story window.
In tomorrow's post, we’ll talk about just how high up the market is now sitting.


