

 Print
Print As a follow-up to yesterday’s look at the yield curve, today we will review employment, another indicator that does a good job of signaling economic risk. The reason employment works as an indicator is simple: More than 70 percent of the economy is made up of consumer spending, and the vast majority of that spending comes from wage income—which is to say, from jobs. No jobs? No spending. No spending? No economy. It really is that simple.
Job growth is also reflective of how businesses feel. Companies won’t hire unless they really need someone and expect that need to continue, so hiring data gives us a direct look at what businesses really think. Strong hiring growth means companies are expanding and expect to continue to do so.
How to measure employment
That said, how should we go about measuring employment? The simplest way, of course, is to look at hiring. But as we have seen, monthly results can vary significantly, so we can’t get a good read from them. Similarly, the simple change over time doesn’t tell us much, as it is either going up or down—with no indication of what might happen next. One is too focused, and the other is not focused enough. Another question is which jobs to include. Government jobs, for example, are less influenced by economic factors than private hiring; as a result, they are not the best economic indicators.
Private jobs. For all those reasons, I look at the change in private jobs over the previous year. The time frame is a useful compromise between recency and scope. And by focusing on the private sector, we zero in on the most economically sensitive and predictive segment of the market. Note also that I use the percentage change, rather than the numerical change, as it best captures the effects of a growing labor market.
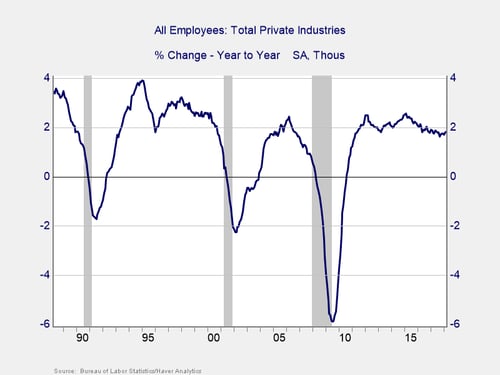
You can see from the chart that this approach has been successful in generating a useful risk signal. Looking at the past three recessions, when job growth dropped below about 1.5 percent year-on-year, the recession started soon thereafter. We are well above that level currently, with the March data up 1.8 percent over the prior year, so recession risk from a job growth standpoint is low.
I use these job numbers because they involve relatively less statistical manipulation than other data series. Other data can also be useful, though.
Hours worked. Another way to look at labor demand is to look at how many hours employees are working. In tight job markets, employers tend to demand more overtime, so even when job growth is declining, worker income and business confidence can still be high—which, in fact, is reflective of where we are right now.
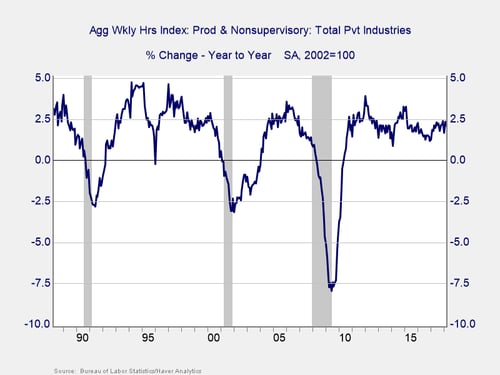
Here you can see that when the change in hours worked declines below about 1.5 percent, a recession follows. For this series, the data shows an even smaller chance of imminent recession, as the current growth rate is at 2.1 percent, a larger spread than for the jobs alone.
Unemployment. Occasionally, I will look at the trend in unemployment by comparing the current unemployment rate with the 10-month moving average.
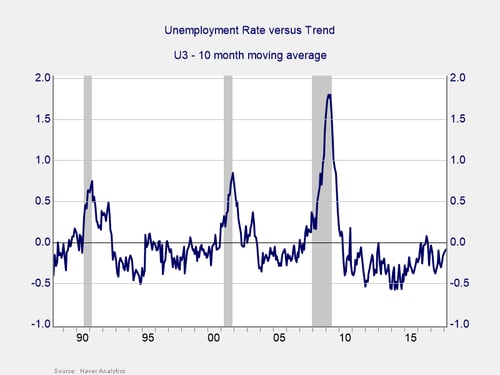
In the chart above, you can see that when the line breaks above zero, which is when the unemployment rate rises above that trend line, a recession follows shortly thereafter. This is a less timely signal than the job-related data, and it has also generated some false alarms, but it is useful nonetheless. Here again we see that the economy is well out of the trouble zone.
A good signal
Once again, as was the case yesterday, we see no evidence of impending recession in the data—another major positive. By taking a more detailed look at where the data comes from, and looking at alternative indicators, we can be confident in the robustness of the signal. Indeed, using job growth as an indicator of economic risk makes sense not only theoretically, but also empirically.
The next risk factor we’ll focus on is confidence, both consumer and business. We’ll take a look tomorrow.


