Print
PrintMarch’s data continued to be good overall, although there was some pullback from February’s very strong reports. Job growth slowed substantially, which was the most notable concern. This is most likely not an immediate problem, however, as long-term trends remain favorable. More worrying is that while confidence remains high, the trend appears to be peaking for both consumers and business. Again, this is more of a change in trend rather than an immediate concern. Fed policy continues to be stimulative, which is helpful, despite the recent rate increase. Overall, this month’s economic data indicates that growth continues, although it may have peaked.
The Service Sector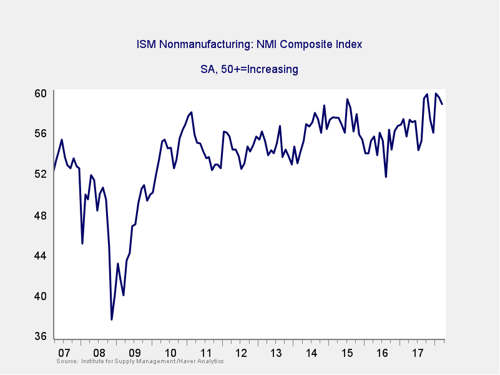
Signal: Green light
Business confidence remained at high levels, although the Institute for Supply Management (ISM) Nonmanufacturing index dropped slightly. The drop—to 58.8 for March from 59.5 for February—was slightly below expectations but still leaves the index close to the post-recession high of four months ago. This is a diffusion index, where values above 50 indicate expansion. This continued strength suggests that growth is likely to continue in 2018, but the recent pullback indicates that growth might have peaked. Going forward, these levels of confidence should keep driving economic growth, leaving this indicator at a green light.
Private Employment: Annual Change
Signal: Green light
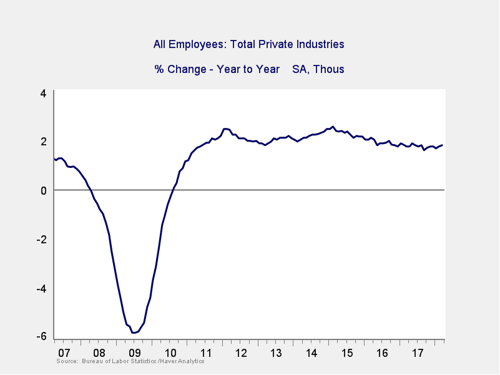
March job growth came in at 103,000. This result is well below the February figure of 326,000—a substantial slowdown. While the weak month is concerning, the fact remains that the long-term trend remains positive, with 2018 growth above that of 2017. Given the volatility of this data, this is likely just normal variation rather than something worse. The annual figure continued to show improvement, so this indicator remains a green light.
Private Employment: Monthly Change
Signal: Green light
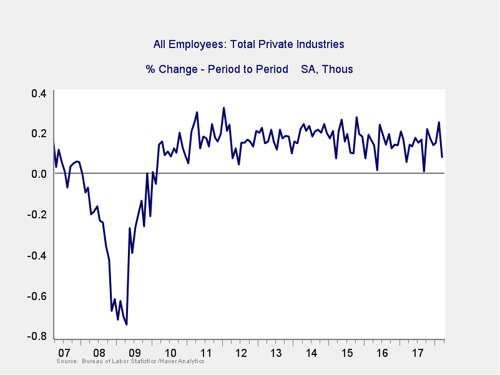
These are the same numbers as in the previous chart but on a month-to-month basis, which can provide a better short-term signal.
As noted above, March was a weak month. But given the very strong start to the year, some pullback is not a concern at this point. Overall, job growth continues to be high enough to keep up with population growth, while the rise in the employment-to-population ratio suggests that people are moving back into the labor force. As with the other signals, and given the continued positive long-term trends, this indicator remains a green light.
Yield Curve (10-Year Minus 3-Month Treasury Rates)
Signal: Green light
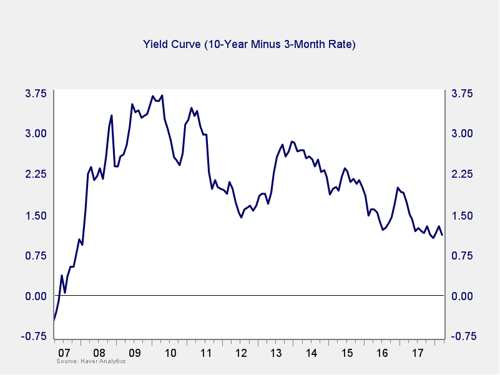
The spread between the 10-year and 3-month rates dropped a bit last month, as the Fed raised rates by 25 basis points (as expected) and longer-term rates ticked down in the face of rising risk perceptions around Washington’s proposed tariffs. While this takes us closer to the trouble zone, we are still outside the immediate risk levels, so are leaving this indicator at a green light. Future rate hikes by the Fed might narrow the spread further, which will be a key area of concern as we move further into 2018 and will need to be watched. For the moment, however, the concern is not immediate.
Consumer Confidence: Annual Change
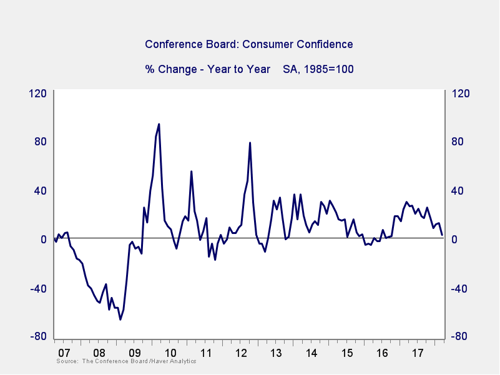
Signal: Green light
Consumer confidence dropped slightly in March, but only from February’s peak, which was the highest level since 2000. The small decline, coupled with substantial improvements a year ago, took the annual change close to zero for the first time in more than a year. While this indicator remains well outside the trouble zone, the sustained decline throughout 2017 suggests confidence growth has indeed rolled over, so we will need to keep an eye on it. That being said, consumer confidence remains at a very high level, and the annual change is still well outside the trouble zone, so we are leaving it at a green light.
Conclusion: Economy growing, positive trends may be peaking
All four indicators remained positive on an absolute basis, but pullbacks in several indicators suggest that the recovery may have peaked as we move into a slower growth phase. Conditions remain favorable overall, however, and the economy gets a green light for April.