

 Print
Print One of the key indicators I look at when evaluating economic and market risks is the yield curve, which is a fancy name for how interest rates for different time periods vary. You would expect the rate an investor needs for a 10-year loan, for example, to be different from what she needs for a 3-month—or 30-year—loan. And, by and large, that is the case. Exactly how different the rates are, however, can change quite a bit, and those changes can tell us a lot about the economy.
Normal and inverted yield curves
Longer loans are riskier than shorter ones, and investors should want to be paid for that risk with a higher rate. That’s common sense; a lot more can go wrong in 10 years than in 2. That behavior—higher rates for longer terms—is almost always what we see, for that reason. But sometimes, shorter rates are higher than longer ones, and that reversal of the normal order is usually a sign of pending trouble.
It is called the inversion of the yield curve, and it happens like this: When the Fed gets concerned about inflation, it raises rates at the short end of the curve; this pushes all short rates higher. At the same time, investors become more fearful and their expectations of growth slow, so they want to buy longer-term bonds. This pushes up the prices of those bonds while their rates decline. This combination of policy action at the short end and fear and risk aversion at the long end makes short rates higher than long ones. It’s also a bad sign for the economy, with the Fed purposely slowing things down and investors getting more fearful. This is why the yield curve is a useful indicator of economic risk.
Using the yield curve as a risk indicator
Using it involves some thought, however. It is easy to say short and long in the above discussion, but what do they really mean in an analytical context? Does “short” mean the fed funds rate, 3 months, or 2 years? Is “long” 10 years or 30? In my economic risk factor updates, I use the 3-month rate and the 10-year rate, but would we get different results using other time periods? Let’s take a look.
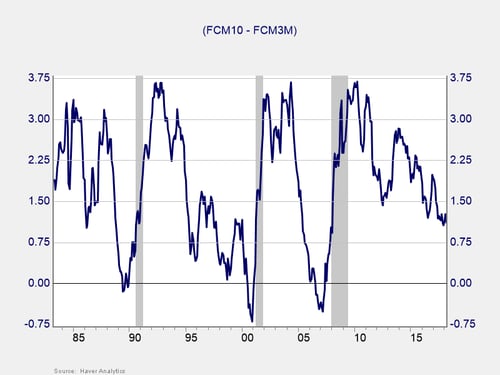
This chart illustrates the U.S. Treasury 10-year rate minus the 3-month rate. Rather than charting both rates, the easiest way to look for pending economic trouble is simply to subtract the short rate from the long one. If the result is below zero, then the yield curve is inverted, and trouble may be on the way. Here, you can see that the inversion happened one to two years prior to each of the past three recessions (the shaded areas). So, it’s a good indicator, though it’s not exactly timely.
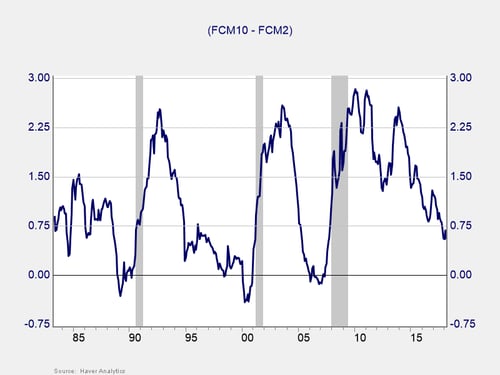
When we look at the 10-year rate minus the 2-year rate in this chart, we see the same thing—the inversion of the yield curve happened about two to three years in advance of each of the past three recessions. This is also a good signal, but it’s somewhat less timely than the previous chart. The same applies with other pairings. That is why I use the pairing I do (10-year minus 3-month), as it gives the most timely signal.
What have we learned?
What can we take away from this study? First, the current yield curve does not indicate an impending recession, which is a major positive. Second, the robustness of the relationship, which covers many different time periods and many different sets of rate pairs, suggests that the yield curve is indeed a valid economic indicator and not a result of data mining. Third, there is no need to look for a different economic risk indicator—the yield curve works just fine. All good things to know as we move forward.
That said, it is always good to understand the indicators we use and to examine alternatives. Tomorrow, we’ll take a look at the employment indicators.


