

 Print
Print Today’s post will conclude this week’s discussion on the major economic risk indicators I follow. After looking at interest rates and jobs, we will close with a discussion of confidence, both consumer and business.
Confidence is important because it is what transforms the ability to spend into actual spending. You may have a good job but not want to buy a new car or house because you are worried about the future. Similarly, a business may be very profitable but unwilling to buy a new machine or building to expand because it sees bad times ahead. Confidence is what turns potential into reality.
Consumer confidence measures
We face the same problems with confidence as we do with the other indicators, however. Today’s high confidence—and it is high—doesn’t tell us much about where it is heading in the next several months. Similarly, like job numbers, confidence can bounce around on a monthly basis. The solution, once again, is to look at annual changes, which give us a better idea of whether confidence is rising or falling against the long-term trend.
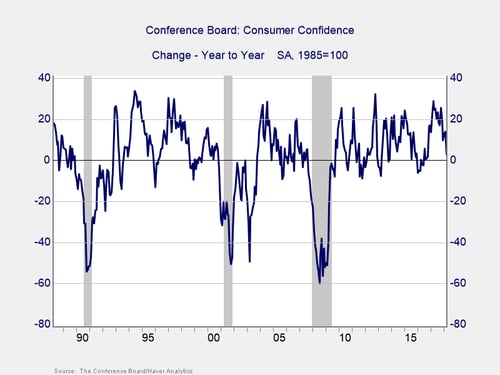
This chart shows annual changes in consumer confidence. Unsurprisingly, drops in this measure typically precede a recession. The magic number seems to be about 20 points, and this is consistent regardless of the starting point. Note, for example, that the 20-point drop in 2000 from a very high confidence level was just as predictive as the drops in 1989 and 2007 from somewhat lower levels. This chart looks at the Conference Board survey, but the one done by the University of Michigan gives similar results—even to the 20-point drop as an indicator of risk.
Within these surveys, separate subindices look at consumer confidence today versus consumer confidence in the future. Perhaps surprisingly, there is little real difference, although a decline in future expectations gives a slightly longer lead time before the pending recession.
This indicator has called the past three recessions within a couple of months before they formally started, so it is quite reliable and timely, which is why I look at it every month. And for the moment, conditions remain favorable.
Business confidence: Manufacturing, nonmanufacturing, or both?
The final piece of the puzzle is business confidence, and here the picture is slightly murkier. The major business surveys have two divisions—manufacturing and nonmanufacturing—along with a composite version that includes both. What’s the problem? The manufacturing survey has been around for a long time, but the nonmanufacturing survey goes back only to 1997, which is not ideal. The question is which we should use, and why.
Another factor, which actually makes things simpler for a change, is that these are diffusion indices. This means that values greater than 50 are expansionary, and values less than 50 indicate contraction. As such, we can see the change in sentiment evolve over time directly instead of having to make annual comparisons.
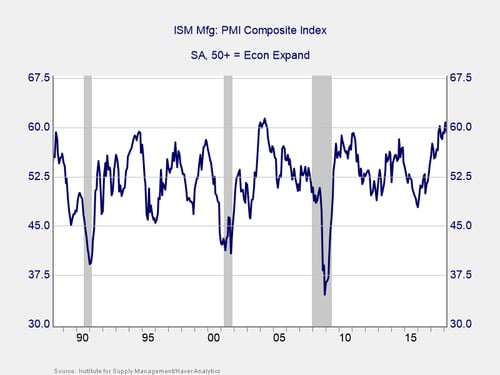
The manufacturing index, with its long history, would be a good indicator of economic risk but for one problem: manufacturing is an increasingly small part of the U.S. economy, making it less reliable as a big-picture indicator. Looking at the past three recessions, the manufacturing index was late for 2008 and issued a false signal in 2015.
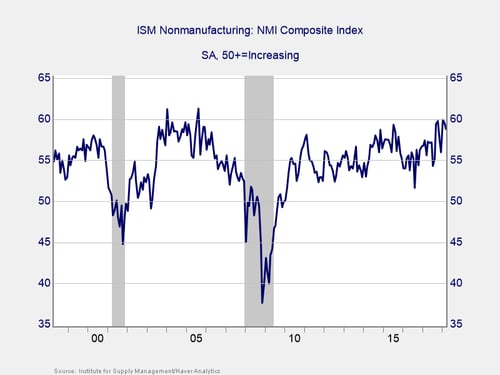
The nonmanufacturing index, despite its shorter history, has been both reliable and timely for the two recessions on which we have data. Plus, it now accounts for the vast majority of the U.S. economy. As it is both more comprehensive and more reliable, this is the indicator I choose to use. The composite indicator, meanwhile, has the same weaknesses as the manufacturing index, particularly as it is influenced by the manufacturing component.
As with the other indicators, business confidence remains expansionary and nowhere near the trouble zone, no matter how you look at it.
Indicators with a strong track record
While all of the major indicators we look at are imperfect, they are among the best available, and in concert, they have been extremely reliable. We can’t rely on any one, of course, or even on all four, which is why we look at the other data I have highlighted. At the same time, with the solid economic rationale behind them, as well as their strong collective track record, we can have confidence that they will continue to work. As such, we should have at least some warning of trouble ahead when the next recession comes along.


