

 Print
Print In my October blog post, I concluded by stating that in an intermediate time frame, things looked shaky for markets. Still, I firmly believed that the S&P 500 was undergoing a correction and that the uptrend would resume in due course. Indeed, since October 31, the S&P 500 is up more than 8 percent and the Nasdaq is up more than 10 percent.
The bearish signals that were detailed a month ago now appear much better. More stocks are hitting new 52-week highs versus 52-week lows, we have seen more accumulation on the S&P 500 than distribution, and the Nasdaq 100 composition has improved greatly. On October 27, 13 percent of the Nasdaq 100 was trading above its 50-day moving average and 40 percent was trading above its 200-day moving average. Fast-forward to November 27, 72 percent of the Nasdaq 100 was trading above its 50-day moving average and 68 percent was trading above its 200-day moving average.
2023 Almost in the Books
With November coming to an end today, we are looking at one of the best November performances of all time for the S&P 500, finishing up 8.92 percent on the month. Since 1950, only four other times has the month of November finished up more than 8 percent, and only during 1954 and 2020 did the month of November finish up more than 8 percent after having a negative month of October. For reference, the S&P 500 declined by 2.2 percent in October 2023.
Looking at 1954 and 2020, we note that they saw positive returns of 5.08 percent and 3.71 percent in December, respectively. If history were to have some sort of repetitive pattern here, this may bode well for 2024.
S&P 500 Quarterly Returns
With one month left in 2023, let’s play with some “what-ifs” for the S&P 500. Imagine a scenario where the situation described above shows some repetitiveness and the S&P 500 can close the year up more than 10 percent and the Q4 return remains positive. As of November close, the S&P 500 is up 18.97 percent on the year and its Q4 return sits at 6.52 percent.
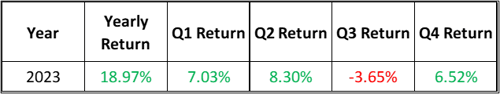
Source: Data from Tradingview. Chart reflects S&P 500 price returns excluding dividends. Index data is based on past performance, which is no guarantee of future results.
Given the above two assumptions and knowing that the S&P 500 Q1 and Q2 returns were positive and that the Q3 return was negative, we will look at two scenarios.
Scenario 1. First, let’s look at the scenario in which Q1, Q2, and Q4 are all positive; Q3 is negative; and the S&P 500 closes the year up more than 10 percent. Since 1900, we see there are eight other times in history where this occurred. Of those, five saw double-digit returns the following year and only two saw negative returns the following year.
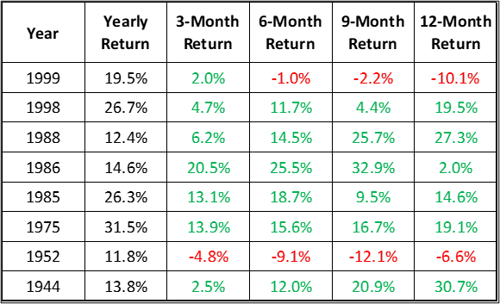
Source: Data from Tradingview. Chart reflects S&P 500 price returns excluding dividends. Index data is based on past performance, which is no guarantee of future results.
Scenario 2. As mentioned before, the S&P 500 is currently up more than 18 percent this year, meaning a 20 percent year may not be a long way off. In the second scenario, we use the same quarterly return criteria as in the first scenario but this time the S&P 500 finished the year up more than 20 percent. This trims down the historical occurrences to three years. As you can see in the chart below, the results have been strong. Each of the following years saw double-digit returns.
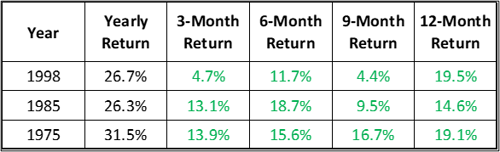
Source: Data from Tradingview. Chart reflects S&P 500 price returns excluding dividends. Index data is based on past performance, which is no guarantee of future results.
Will December’s Performance Matter for 2024?
As you can see from the data, having the S&P 500 close the year up more than 20 percent might actually matter. It is worth noting that this is historical data, and there is no assurance that the S&P 500 will perform similarly in the future. Additionally, in 1999, the S&P 500 finished up 19.5 percent on the year, so we are talking about 50 basis points from being included in the second scenario.
Regardless, the number needed for a 20 percent or greater year for the S&P 500 is 4,608.
A stock’s moving average is a commonly used indicator in technical analysis that shows the average stock price over a specific period, helping to smooth out price fluctuations and identify trends.


