

 Print
Print In my last blog post on whether markets might rally by year-end, I detailed a few technical indicators that suggested taking a cautious approach, as well as a reason for potential optimism. Today, I’d like to provide updates on two of those indicators, introduce new data, and wrap up with some thoughts on where we go from here.
52-Week Lows Keep Coming
I highlighted a worrying trend after the market close on September 22: 43 U.S. equities had reached new 52-week highs, while 376 had plummeted to new 52-week lows. Fast-forward to October 27, and the scenario deteriorated further. Only 18 names hit a new 52-week high, while a staggering 587 names sank to new 52-week lows.
Assessing the Nasdaq 100 Index Damage
I also previously noted the Nasdaq 100 Index’s concerning state. On July 19, 81 of its 100 names were trading above the 200-day moving average (dma), and 85 were above the 50dma. Two months later, these numbers dwindled to 60 names above the 200dma and 17 above the 50dma. As of October 27, only 40 names were above the 200dma, and a mere 13 remained above the 50dma.
Counting the S&P 500 Distribution Days
Legendary investor William O’Neil defined a distribution day as occurring when a major stock index falls 0.2 percent or more on volume greater than the prior day. Since the start of August (63 days), the S&P 500 has had 23 distribution days. This type of excessive and dominant selling has occurred only two other times in history since 1950: June–July 1962 and June–July 1970.
Although the returns following these historical instances have all been positive, the market’s inability to mount a strong rally from these oversold conditions underscores the need for a cautious approach.
Identifying a Pattern of Corrections
Despite these bearish indicators, I maintain a cautiously optimistic outlook. I believe we are currently in an intermediate correction within a new bull market that began off the lows in October 2022. This belief is supported by historical data of the S&P 500 dating back to 1950, which shows a pattern of corrections following strong rallies off significant bear market lows.
Between January 4 and October 13, 2022 (282 days), the S&P 500 fell 27.54 percent, which will be looked back upon as the 2022 bear market. Between October 13, 2022, and July 27, 2023 (287 days), the S&P 500 ran 31.95 percent, which marked the first move off the October bear market lows. Since that high hit on July 27, the S&P 500 has fallen 10.92 percent over 92 days. I believe this 10.92 percent move is simply an intermediate correction.
I ran criteria through an Excel sheet to identify similar historical occurrences: a market fall of more than 20 percent over 250 days, followed by a bounce of more than 30 percent over an equal or greater period, and a subsequent correction of more than 10 percent over 90 days or more. In addition to the current scenario, this analysis yielded the following instances:
- Between July 6 and July 23, 2010
- Between September 10 and October 3, 1975
- Between August 3 and August 10, 1971
July 2010. In 2008, the global financial crisis bear market lasted 512 days and saw the S&P 500 correct more than 57 percent. The S&P 500 ran more than 80 percent off the bear market bottom over 416 days, topping on April 26, 2010. Then, in the summer of 2010, the S&P 500 experienced an intermediate correction of about 17 percent (see chart below).
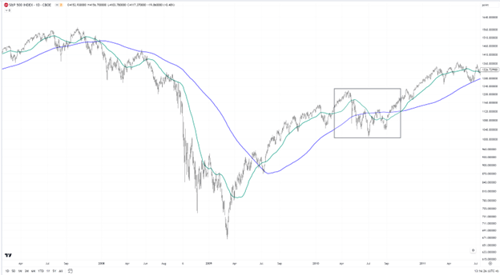
Source: Tradingview. The blue line represents the 200dma, and the green line represents the 50dma.
September–October 1975. During this bear market, the S&P 500 topped in January 1973 and then experienced just under a 50 percent decline over 631 days. The S&P 500 then ripped 58.5 percent off the bear market bottom, topping on July 15, 1975. Finally, in the summer/fall of 1975, the S&P 500 experienced an intermediate correction of 15.5 percent that lasted 64 days.
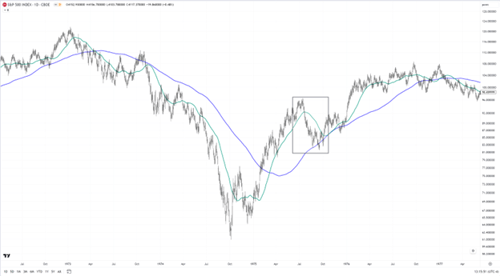
Source: Tradingview. The blue line represents the 200dma, and the green line represents the 50dma.
August 1971. During this bear market, the S&P 500 topped in December 1968 and then experienced a 37 percent retracement over 540 days. Off the May 1970 bottom, the S&P 500 ran almost 54 percent over 337 days. As you can see in the chart below, this correction was a bit longer and almost had two parts to it. The first correction was from April–August 1971, when the S&P 500 fell a little bit more than 12 percent. After a brief bounce, the S&P 500 corrected even more, hitting a new low in November 1971, falling more than 15 percent since that April 1971 high.
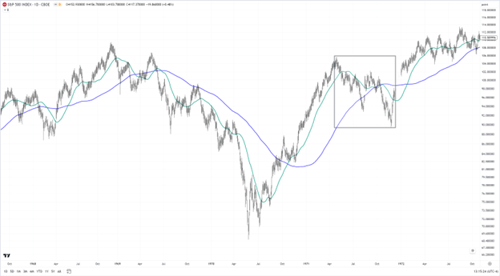
Source: Tradingview. The blue line represents the 200dma, and the green line represents the 50dma.
Below is a chart of the subsequent returns over different time periods for each of these three occurrences:
|
Date |
7-Day Return |
30-Day Return |
60-Day Return |
90-Day Return |
150-Day Return |
250-Day Return |
|
July 6, 2010 |
6.66% |
6.27% |
11.35% |
18.54% |
28.30% |
28.46% |
|
September 10, 1975 |
2.49% |
8.26% |
4.83% |
17.34% |
20.60% |
24.48% |
|
August 3, 1971 |
1.58% |
5.57% |
–0.76% |
2.59% |
15.09% |
13.51% |
|
Average |
3.58% |
6.70% |
5.14% |
12.83% |
21.33% |
22.15% |
Markets Don’t Move in a Straight Line
The market continues to send bearish signals on an intermediate time frame, with prevalent selling and numerous equities trading below their key dmas. But history has taught us that corrections are an integral part of bull markets—and markets don’t always move in a straight line. While the short term may bring more selling and declines, I firmly believe that the S&P 500 is undergoing a correction, setting the stage for the uptrend to resume in due course.


