The Independent Market Observer

10/7/13 – The Debt Ceiling and Your Portfolio

October 7, 2013

The government shutdown has gotten most of the press coverage so far, but there is a related and bigger issue pending in the next couple of weeks: the debt ceiling. Although the federal government has partially shut down, it continues to spend money on many items. Normal government financing requires regular additional borrowing, as we typically spend more than we take in.

Continue reading → Leave a comment

Market Update for the Quarter Ending September 30, 2013

October 4, 2013

Despite turbulence, a strong September and third quarter

Despite economic and political turmoil, markets performed well across the board in September, with almost all asset classes showing strong returns, reversing many of August’s losses. This also resulted in positive overall quarterly performance.

Continue reading → Leave a comment

10/3/13 – No News from DC, Some Good News from Main Street and Europe

October 3, 2013

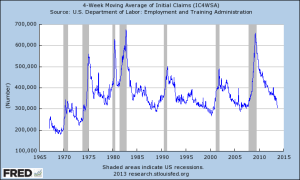
Since there’s really no movement in the DC stalemate, I thought I’d highlight some good news today. I continue to keep an eye on the government, and the risk grows daily. At the same time, though, it’s important to remember that there is life beyond the Beltway (for those who don’t know, that’s the highway surrounding Washington, DC) and that the real economy is actually doing pretty well. Even as DC stares and Wall Street trembles, Main Street has some news to be glad about.

1. Initial jobless claims remain quite low, at 308,000.

Continue reading → Leave a comment

10/1/13 – The Inflation Problem, Part 5: Real-World Data Points

October 1, 2013

“In spite of the cost of living, it’s still popular.” — Laurence J. Peter

Continue reading → Leave a comment

9/30/13 – The Inflation Problem, Part 4: Like the Salesman Says, Think Quality, Not Price!

September 29, 2013

As discussed in the previous installment in this series, adjustments are at the core of the debate about inflation, but another way to look at the problem is to consider exactly what’s being measured here. Substitution, of one type of good for another, is a clear case of something being different. What about when you’re talking about the same item, though—say a TV set? Is an HDTV with a flat screen and built-in Internet access the same as an old tube TV without a remote?

These adjustments—for quality, utility, or both—are known in the trade as hedonic adjustments. Again, Shadowstats leads the charge against the current adjustment method, using government-mandated gasoline additives as the poster child for fraudulent adjustments. In its response, the Bureau of Labor Statistics outlines its methodology and gives two examples: a candy bar, which is selling for the same price as before but now weighs half an ounce less, and a TV, which is now available only as an HD model at twice the price. Is an adjustment necessary? If yes, how should it be calculated?

Continue reading → Leave a comment

9/27/13 – The Inflation Problem, Part 3: Political Statistics?

September 27, 2013

“I gather, young man, that you wish to be a Member of Parliament. The first lesson that you must learn is, when I call for statistics about the rate of infant mortality, what I want is proof that fewer babies died when I was Prime Minister than when anyone else was Prime Minister. That is a political statistic.” — Sir Winston Churchill

There are three significant criticisms of the Consumer Price Index (CPI) methodology. The first is that the substitution of items in the basket of goods is not appropriate (the “hamburger versus steak” argument). The second is how to account for changes in the quality of goods sold. The third is the use of rental equivalence to measure housing costs and their contribution to the CPI.

Continue reading → Leave a comment

9/26/13 – The Inflation Problem, Part 2: Diving into the Details

September 26, 2013

“Facts are stubborn things, but statistics are more pliable.” — Mark Twain

Economic statistics are backward looking, not forward; in that sense, they always reflect the past. Moreover, given data collection time lapses, costs, and other issues, the data is always incomplete and more or less out of date. Finally, in a vast and heterogeneous economy, the applicability of one statistic to everyone is impossible. These are the general issues that any statistical service wrestles with. No figures are going to be perfect. At the same time, it’s important to know where the numbers you depend on come from, and what their strengths and weaknesses are.

Continue reading → Leave a comment

9/25/13 – The Inflation Problem, Part 1: Defining the Problem

September 25, 2013

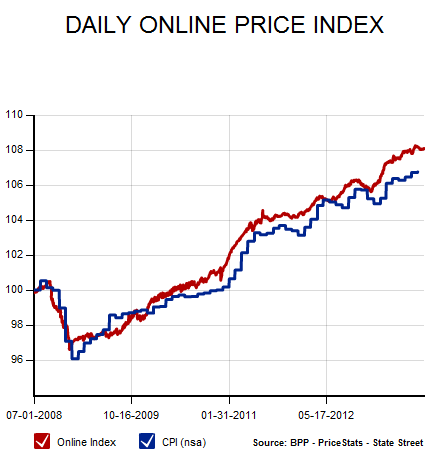
I wrote about inflation risk at length back in January of this year. Although inflation wasn’t a concern at the time, I noted that we would have to be watchful when three things happened: a decrease in the unemployment rate, a resumption of bank lending/consumer borrowing, and faster growth in GDP. All three of these are happening now, so it’s time for another look.

Another reason to revisit inflation is the Fed. One of the arguments for maintaining the Fed’s stimulus program, albeit one that hasn’t gotten a lot of play, is that inflation is still well within a reasonable range. With the stimulus set to continue, we can reasonably expect inflation to continue at current levels, and quite possibly to increase. This is actually a goal of the Fed’s—and it usually gets what it wants.

Continue reading → Leave a comment

9/18/13 – More Thoughts About Tesla and Energy

September 18, 2013

Yesterday’s post about Tesla and the valuation of its stock prompted some second thoughts after I sent it off, particularly the offhand mention of déjà vu. I stand by the conclusion that Tesla’s stock is probably overvalued, but I think it’s worth spending some more time talking about the company as a bellwether for very positive changes in the U.S. economy. What Tesla means extends well beyond whether the company makes it or not.

Let’s set the wayback machine to the dot-com boom. I remember it well, as I was running a start-up in Seattle at the time, among other things. The world looked like it was changing for the better; the new economy was going to make us all rich. People were going to play, shop, and communicate online.

Continue reading → Leave a comment

9/17/13 – A Look at Apple and Tesla: Cool Technology and Market Value

September 17, 2013

My wife, Nora, is a gadget freak. She had (and used) a PalmPilot. She is all over her iPhone. She used her MacBook Air laptop so much and so effectively that I ended up getting one as well. She has a TDI Clean Diesel VW and optimizes her mileage with the way she drives.

Continue reading → Leave a comment

Subscribe via Email

Crash-Test Investing

Hot Topics


New Call-to-action

Conversations

Archives

see all

Subscribe


Disclosure

The information on this website is intended for informational/educational purposes only and should not be construed as investment advice, a solicitation, or a recommendation to buy or sell any security or investment product. Please contact your financial professional for more information specific to your situation.

Certain sections of this commentary contain forward-looking statements that are based on our reasonable expectations, estimates, projections, and assumptions. Forward-looking statements are not guarantees of future performance and involve certain risks and uncertainties, which are difficult to predict. Past performance is not indicative of future results. Diversification does not assure a profit or protect against loss in declining markets.

The S&P 500 Index is a broad-based measurement of changes in stock market conditions based on the average performance of 500 widely held common stocks. All indices are unmanaged and investors cannot invest directly in an index.

The MSCI EAFE (Europe, Australia, Far East) Index is a free float‐adjusted market capitalization index that is designed to measure the equity market performance of developed markets, excluding the U.S. and Canada. The MSCI EAFE Index consists of 21 developed market country indices.

One basis point (bp) is equal to 1/100th of 1 percent, or 0.01 percent.

The VIX (CBOE Volatility Index) measures the market’s expectation of 30-day volatility across a wide range of S&P 500 options.

The forward price-to-earnings (P/E) ratio divides the current share price of the index by its estimated future earnings.

Third-party links are provided to you as a courtesy. We make no representation as to the completeness or accuracy of information provided on these websites. Information on such sites, including third-party links contained within, should not be construed as an endorsement or adoption by Commonwealth of any kind. You should consult with a financial advisor regarding your specific situation.

Member FINRASIPC

Please review our Terms of Use

Commonwealth Financial Network®