The Independent Market Observer

Is the Employment News Really as Good as It Looks?

July 15, 2014

Although the headline employment numbers look strong, some say that the underlying reality is actually a lot worse, with few full-time jobs and many discouraged workers. According to the skeptics, it’s a Potemkin recovery, dependent on the fact that many people have simply dropped out of the labor force.

Continue reading → Leave a comment

Two Cheers for the Employment Report

July 7, 2014

The string of 200,000-plus employment reports just got a little longer.

The number at the end of last week—288,000 new jobs—far surpassed the expected level of 215,000. It’s also well above the figures for the preceding months, which were themselves strong. The consistency of the gains provides further support for their durability.

Continue reading → Leave a comment

Full Recovery Ahead? A Big-Picture Look at Employment Data

June 16, 2014

Returning to the office after 10 days out, I have a lot of reading to catch up on. One benefit of that, though, is being able to connect individual data points for a bigger-picture view.

Employment, in particular, caught my eye this morning. Taken together, a slew of positive employment numbers paint an even better picture. (The employment data here is from various federal sources, as compiled by Ned Davis Research.)

Continue reading → Leave a comment

Will We Hit 200K? A Prospective Look at the Employment Numbers

June 6, 2014

This is a bit of a speculative post, as I’m writing it a day ahead of time, before the next set of employment numbers comes out. (I’ll be on a plane to Norway for a family vacation when they do.) I may have to revise or retract some of my thoughts here, but hopefully the main points will survive.

Continue reading → Leave a comment

5/2/14 – Employment Report Points to More Strength in the Economy

May 2, 2014

More evidence for the “snowdown” thesis is in. The unexpectedly strong April employment report, with a gain of 288,000 jobs, surprised pretty much everyone, and shows that hiring has come back in a big way after the weak first quarter. Even more encouraging are the upward revisions to first-quarter job growth, with 36,000 more jobs created than were initially reported.

Continue reading → Leave a comment

2/10/14 – The “I Quit” Ad and Other Employment Indicators

February 10, 2014

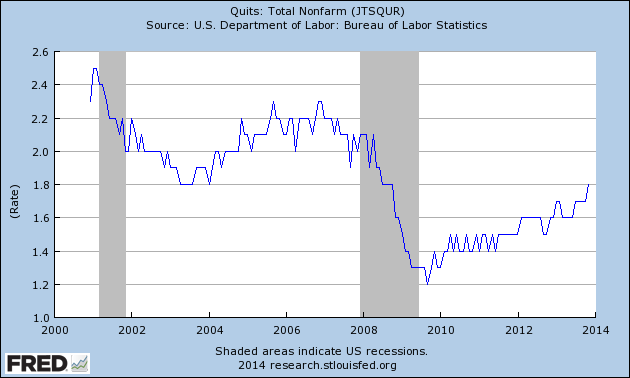
One of the more interesting ads in a generally disappointing Super Bowl—I know I wasn’t the only one looking forward to a much more exciting confrontation between the number-one offense and the number-one defense—was the puppet-maker who supposedly quit her job on national TV. I have to say, if it was real, it took guts. If the new business doesn’t work out, she may have a hard time going back.

Continue reading → Leave a comment

1/13/14 – Does Raising the Minimum Wage Really Reduce Employment?

January 13, 2014

A couple of weeks ago, we had a fairly spirited debate in an Asset Management department meeting over the economic consequences of raising the minimum wage. Just for fun, and because I like to argue, I strongly took the pro side, contending that the positive consequences would outweigh the negative. This is not a particularly common (or popular) stance in the economics and investing community, but it turns out that you can make a good case for it.

Continue reading → Leave a comment

1/10/14 – Big Surprise on Weak Employment Numbers: Noise or Nail-Biting?

January 10, 2014

After all the optimism embodied in the Fed’s recent minutes, at least as I read them, the employment report this morning was a shocker. Instead of the expected 200,000 or so gain in jobs, the figure came in at 74,000, well below the lowest estimate. What the heck happened?

Continue reading → Leave a comment

12/6/13 – Ending the Year on a Good Note: Employment Up, Budget Deal Possible

December 6, 2013

Another surprisingly good economic stat came out today: Employment increased by 203,000 for November, higher than the expected 185,000. Unemployment decreased to 7 percent for the headline U-3 number, while the underemployment rate, the U-6, decreased by a full 0.6 percent to 13.2 percent.

Continue reading → Leave a comment

9/6/13 – The Employment Numbers and the Fed

September 6, 2013

I was in New York yesterday, meeting with clients and doing interviews, and the one thing everyone wanted to talk about was the employment numbers—the initial unemployment claims earlier in the week and today’s employment figures. Looking at the commentary, one paper called today’s release “probably the most scrutinized employment report in recent history.” So, now that they’re out, it seems only fair to take a look at the numbers.

Continue reading → Leave a comment

Subscribe via Email

New call-to-action
Crash-Test Investing

Hot Topics


New Call-to-action

Conversations

Archives

see all

Subscribe


Disclosure

The information on this website is intended for informational/educational purposes only and should not be construed as investment advice, a solicitation, or a recommendation to buy or sell any security or investment product. Please contact your financial professional for more information specific to your situation.

Certain sections of this commentary contain forward-looking statements that are based on our reasonable expectations, estimates, projections, and assumptions. Forward-looking statements are not guarantees of future performance and involve certain risks and uncertainties, which are difficult to predict. Past performance is not indicative of future results. Diversification does not assure a profit or protect against loss in declining markets.

The S&P 500 Index is a broad-based measurement of changes in stock market conditions based on the average performance of 500 widely held common stocks. All indices are unmanaged and investors cannot invest directly in an index.

The MSCI EAFE (Europe, Australia, Far East) Index is a free float‐adjusted market capitalization index that is designed to measure the equity market performance of developed markets, excluding the U.S. and Canada. The MSCI EAFE Index consists of 21 developed market country indices.

One basis point (bp) is equal to 1/100th of 1 percent, or 0.01 percent.

The VIX (CBOE Volatility Index) measures the market’s expectation of 30-day volatility across a wide range of S&P 500 options.

The forward price-to-earnings (P/E) ratio divides the current share price of the index by its estimated future earnings.

Third-party links are provided to you as a courtesy. We make no representation as to the completeness or accuracy of information provided on these websites. Information on such sites, including third-party links contained within, should not be construed as an endorsement or adoption by Commonwealth of any kind. You should consult with a financial advisor regarding your specific situation.

Member FINRASIPC

Please review our Terms of Use

Commonwealth Financial Network®