

 Print
Print One of the headlines I have been asked about recently is the strong dollar. People are concerned about what it means, how it could hurt the U.S. economy, and, of course, how it will affect their investments. Good questions all.
In many respects, this is a refreshing change from the questions I get every couple of years about the collapse of the dollar. Regularly, the dollar declines in value against other currencies. Then, the doomsayers start warning about how the world is coming to an end—but if you subscribe to their newsletter (and pay in U.S. dollars), they will protect you! I wrote about that most recently in June 2020, and you will notice the dollar has not collapsed since.
A Perfect Storm?
While today’s concerns are at least different, they are not really any more worrying over the long term. There are and will be effects on the economy and markets from the dollar’s appreciation. But over time, both will adjust, as we have seen again and again. This is part of a normal cycle of currency values.
What drives that cycle is a combination of a few things: U.S. interest rates compared to international rates, general inflation levels, and the level of fear in markets that could drive a flight to safety in U.S. assets. Right now, all of these are positive for the dollar, strongly so for several. In many ways, this is a perfect storm of strong dollar effects. Again, over time each of them will fade.
What’s the Big Picture?
To start, let’s take a look at the big picture. The chart below shows the trade-weighted dollar exchange rate as calculated by the Fed. The red line is in nominal dollars (i.e., without considering the effects of inflation), while the green line is real dollars (i.e., after adjusting for inflation). That view immediately gives us some interesting information.
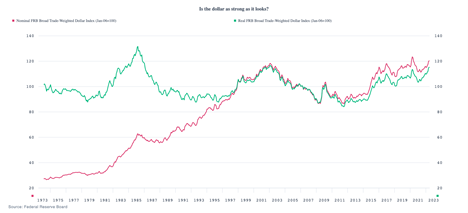
Headline exchange rates are based on nominal values: you exchange today’s dollars for today’s other currencies, and inflation rates are baked in. As such, you would expect inflation-based exchange rates to differ from non-inflation rates if inflation is high. And that is just what we do see.
From the late 1990s to the mid-2010s, when inflation was low, the two lines were almost identical. Before that, though, when inflation was higher, the slope of the nominal line was steeply negative, which is what you would expect with higher inflation during that period. Similarly, as inflation started to pick up in the late 2010s and has since taken off, the slope of the nominal line increased again, running above the real line. That inflation-driven increase is part of what is driving the current high value of the dollar, but that will change over time as inflation levels here and abroad shift. As such, when we consider the real strength of the dollar over time, we should net out the effects of inflation.
A Normal Cycle?
This is what the green line does, looking at real exchange rates. Again, we immediately can draw a couple of important conclusions. First, the real dollar trades within a more limited range, usually between about 80 and 120 on the graph’s scale. Second, it usually reverts to around the middle of that range, or 100. After we net out inflation, anything within that range represents a normal cycle. If we take the data above as representative, there is roughly a 10–15 year cycle from rough to peak. Looking at the last trough, that was about 10 years ago. If we are in a normal cycle, higher inflation is right on schedule. Rather than an unexpected surprise, this is what we have seen multiple times before.
But that doesn’t explain why we get the cycle, until we consider what else has been happening at those points. The final point worth taking from the chart is this: when you look at previous periods when the real dollar was at highs, it was typically in the aftermath of an economic rough spot, when the Fed kept rates higher than other central banks. You can see that in the early 1980s most clearly, but also after the dot-com crash and after the financial crisis. Again, this is what is happening—the Fed is raising rates, and U.S. rates are above international rates—and the dollar is strengthening, as expected.
We should expect a stronger dollar as all of the winds are blowing that way. But this is the key point: even given that, the dollar’s value is still within the historical range. Even as all the stars align, the dollar is still under control. So, the economic and market effects are still ones we have seen before.
Time to Panic?
That is why I am not worried now any more than I was two years ago. The dollar wasn’t collapsing then, and it is not taking off for the stars now. In both cases, it has been responding to very real economic and political constraints, but it’s doing so in a rational way. Time to panic? Not at all. Keep calm and carry on.


