 The other day in my post on the likelihood of another market crash, I pointed out that stocks could be viewed as either cheap (based on expected earnings growth and the forward P/E ratio for the past five years or so) or expensive (based on most of history before that). The real question, going forward, is whether the past five years are a better guide for the future or whether prior history is. In other words, are things different this time?
That’s usually a setup to conclude that, no, it really isn’t different this time. But the reality is that a number of things have been different since the crisis. Most notably, for our purposes today, is that interest rates have been much lower since the crisis—especially over the past five years—than in recent history. If rates are different, then mathematically, stock valuations should be different as well.
Let’s do the math
The reason is simple: stocks are valued on the present value of their future earnings. Regardless of the earnings, a lower interest rate will mean the present value of stocks is higher. So, mathematically, lower interest rates should raise stock valuations and prices.
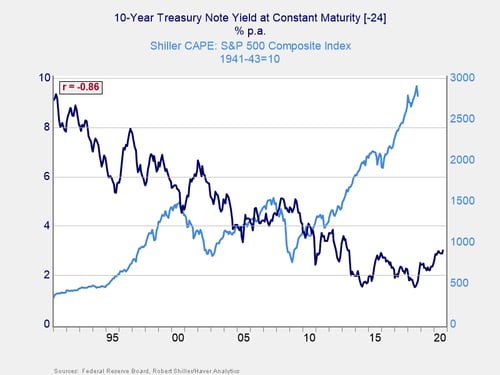
When we put that idea to the test, as shown in the chart below, it works in the real world as well. Using the longer-term cyclically adjusted P/E ratio to wash out some of the volatility, we can see that interest rates and stock valuations show an extremely high –86% correlation with a two-year lag. In other words, as interest rates rise, valuations decline almost all the time.

This data sheds some light on the market declines in recent weeks and gives us some guidance about how to view the future.
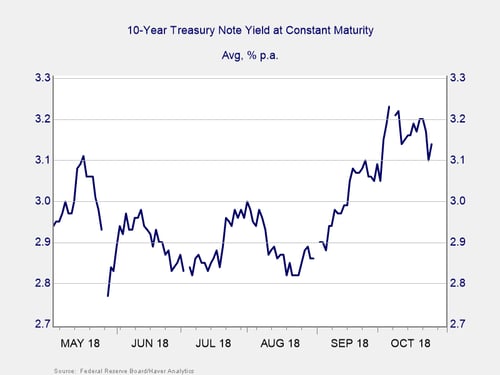
When we look at the spike in interest rates in September and October (see chart below), a downward adjustment in valuations and prices makes sense. When we look at the drop back in rates in recent days, the partial recovery also makes sense. Not only did the spike in rates rattle markets because of its speed, it also plausibly reduced the overall values of stocks. The pullback in rates moderated that damage, letting stocks recover somewhat. This is a useful guide to what happened and why.

More headwinds ahead?
It is also a useful frame for analyzing the future. If rates stay where they are, given the 24-month lag in the first chart, we can reasonably expect that valuation drag to persist and act as a headwind. If rates go up, even slowly, that headwind will get worse.
Again, this reasoning makes sense both mathematically and from history. Back in 2007, at the peak of the bubble, stocks were less expensive than they are now. That made sense, given the level of interest rates—just as more recent valuations made sense given the rates then. All we are saying here is that as interest rates normalize up (if they do), valuations should normalize down as well. Both mathematically and empirically, that is a reasonably straightforward statement.
It does, however, place another set of headwinds in the face of the market going forward. If you expect the economy to keep growing strongly, rates will keep rising. This will hit the stock market through valuations. If, on the other hand, you expect growth to slow and rates to steady or fall, then that will hit earnings growth and hit the stock market that way. Either way, the past couple of weeks have shown that it is getting more and more difficult to thread the needle between growth and rates that keeps the market moving higher.
Don’t fight the Fed
There is a simpler and easier way to state this as well—don’t fight the Fed. Often quoted when the Fed is cutting rates and the market is moving higher, the flip side applies just as certainly. This is the real lesson of the past couple of weeks: keep an eye on rates because they will tell us which direction the market will be headed over time.


 Print
Print

