

 Print
Print I still suspect that current market volatility will ultimately prove to be a short-lived pullback. But there is no doubt that the risks are rising. Yesterday’s drop started to show signs of what could be a break in confidence, which could lead to further losses. As such, we need to start thinking about what those losses might mean. Even if this isn’t the next big market crash, we can reasonably expect that to show up in the next couple of years. So, this line of thinking certainly isn’t wasted effort.
Valuation levels
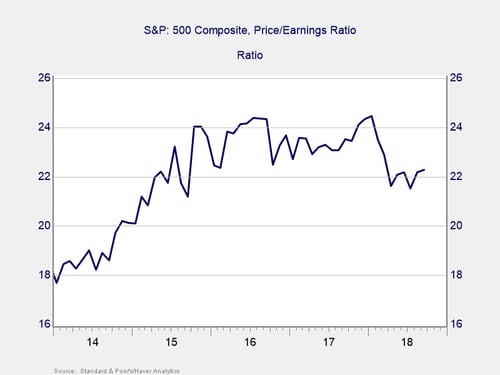
Let’s start by defining where we think the market should reasonably be priced. This level will give us a guideline to where we are now—and where we might end up. The chart below shows the valuation level of the S&P 500 based on the past 12 months of earnings for the past 5 years. Right now, for the period from 2015 on, we are at the lower end of the range. By this data, stocks are cheap right now, and this is basically the argument for a recovery. If valuations move back to the middle of the recent range, we would see stocks move back up meaningfully, which would put the current pull down behind us.
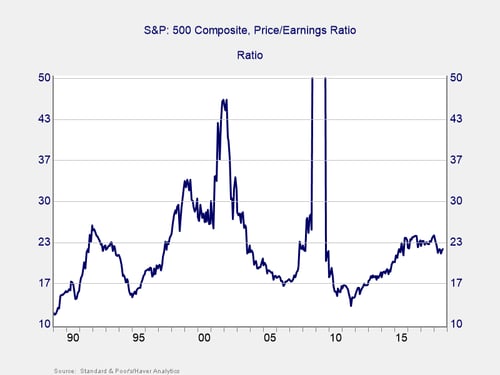
On a longer-term basis, however, stocks remain expensive. Prior to the past five years, stock valuations tended to be well below where we are right now. In bubble periods, of course, valuations rose on higher stock prices; in collapses, valuations also rose because earnings collapsed. Excluding those areas, though, valuations have tended to stay in the 16x to 18x range, or about 20 percent to 25 percent below where we are right now. On a valuation basis, you can make an argument that, based on history, stocks still have a way to decline.
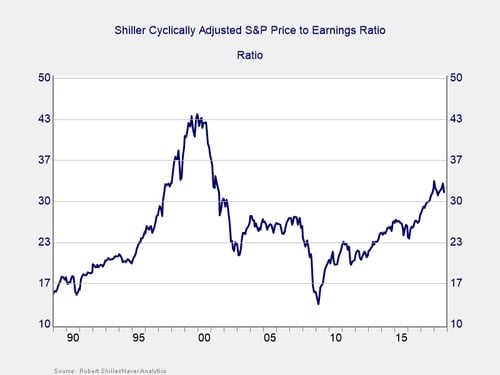
That argument is also supported by using a longer-term P/E ratio. In this case, the average is around 25 or so. We are now at about 31, suggesting (again) a 20-percent to 25-percent downward move.
These numbers, of course, use average valuations. Typically, in a real bear market, valuations don’t stop at averages but keep going down.
In the 2000 crash, for example, the S&P 500 was down more than 40 percent; in the 2008 crisis, the drop was more than 50 percent. Something to keep in mind.
These scenarios would be something of a worst case. As I’ve said, I don’t see that with the underlying fundamentals as healthy as they are. Nonetheless, if we are really to consider what a bear market would mean and what the “big one” would look like, these factors are what we have to consider.
So, where are we today?
Markets are up as of early afternoon, suggesting that the signs of panic from yesterday are not carrying through. This news is encouraging. The total damage, with the S&P 500 down by a bit more than 8 percent as I write this, is still within a normal range—although certainly not insignificant. In many ways, we are exactly where we were earlier this year, in late 2015/early 2016, or for that matter in early 2011.
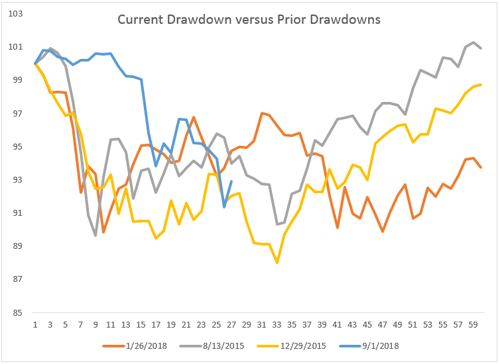
In fact, Pete Essele of our Asset Management group ran the chart below, which shows the current pullback (in blue) compared with three previous ones. Note how the current decline is very much consistent with the earlier ones. Also note that they suggest we may see some further downside—before a rebound. Past performance is, of course, no guarantee. But the chart shows very clearly that we have been somewhere very similar to now several times in the past couple of years.
Planning for the big one
While the big one is likely at some point, the data suggests the time is not now. In fact, the results from previous pullbacks—when the underlying fundamentals were also healthy—suggest a bounce back is likely. While further volatility is also likely, the end is very probably not near, at least yet.
Even if that holds true, the appropriate response is not to breathe a sigh of relief and move on. Instead, you should seriously consider what you would do if it were the big one. It could be, after all. But even if it isn’t? Let’s take time to plan for when it is. When it comes, it will likely be much worse than what we are seeing right now. The time to prepare is now.


