

 Print
Print We closed the last post in this series with the observation that, even if the U.S. “won” the trade war, there would be collateral damage—both here and throughout the world. That turned out to be a timely point, as we have seen in the financial markets over the past week.
With markets pulling back on trade fears, only to bounce after the “truce” dinner between the Chinese and U.S. leaders and then to decline once more on the “tariff man” tweets, financial markets have demonstrated they might be part of that collateral damage. There are growing economic risks as well, with even the Fed publicly considering slowing its planned increases over the next year as those risks increase. Collateral damage is no longer likely. It’s here now.
The question is whether this damage will get worse. If so, what should we, as investors, do about it? Today, I want to look at some historical data and lay out some broad-brush conclusions with respect to the U.S.
Lower trade
The key point here, in a potential trade war, is that there will be less trade, with slower growth at a minimum and quite possibly an absolute decline. This may seem obvious, but for all the speculation about what might happen in a broader sense, this is where it has to start. Lower trade will be the foundation for everything else.
Given that, let’s get some historical context. In the chart below, we can see that trade growth averaged between 5 percent and 10 percent in the booms of the 1990s and 2000s, with a dip during the dot-com bust. After the financial crisis, though, trade growth ran between 0 percent and 3 percent, ticking up to 5 percent recently before dropping again.
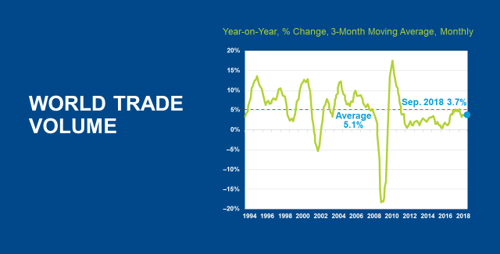
Source: FactSet, J.P. Morgan Asset Management, Netherland Policy Analysis
This is a limited data set, of course, and it is hard to distinguish causality. But on the face of it, we see faster trade growth in good times and slower trade growth in bad times. There is at least the possibility that if trade growth slows, we are headed for more bad times.
Beyond the short-term empirical data above, this relationship also makes sense with everything we have discussed over the past 30 years. Trade and economic openness, after all, are what made the new world. As that closes, we move closer to the old world model, with all that implies. Economic theory also backs up this observation.
Slower growth and higher costs
Closing markets will likely mean slower growth (something we are already seeing here in the U.S. as export growth slows) and higher capital costs (something we have also seen signs of). Although the economic trends remain positive—slowing growth is still growth—trade conflict is likely to be a headwind in an already tough environment.
Abroad, the effects are likely to be worse. China, as we have noted, is much more exposed to trade than the U.S., as is most of Europe. Any effects will be worse there. Again, we are already seeing this in many areas. Most exposed of all will be the emerging markets. (We will have a more detailed look at that next week, from Anu Gaggar, our excellent international analyst.)
This scenario is in the short term. Even if we do get a positive deal, the ongoing issues will persist and likely keep trade growth slower and economic openness lower than they have been. That will mean a couple of things.
Time to moderate our expectations
First, even if the U.S. and China come to terms, China will likely be selling less to the U.S. and be less well disposed to the country. That means, at a minimum, it won’t be buying more U.S. government debt and may well buy less if it can. Other countries will face the same dynamic. With less capital available for the U.S. government to borrow, even as the borrowing rises, we can expect interest rates to trend up.
As fixed income investors, that means we have to moderate our expectations. Over the past several decades, fixed income investments paid out their coupons and appreciated as rates declined. Going forward, we are likely to get coupons without the appreciation and will have to worry about potential declines if interest rates do trend up.
For equity markets, the tailwinds of growing markets, lowered costs, and cheaper capital are likely to reverse. It isn’t that markets won’t grow, but quite possibly they will not grow as fast. Again, we have to moderate our expectations.
Return to the old world
Different areas will have different results, of course, which we will discuss in a concluding post next week. But when we look at current conditions, the narrative of the new world potentially changing back to the old looks, if not inevitable, certainly possible. As investors, we need to be aware of that and plan accordingly.


