

 Print
Print In early March, we saw markets drop worldwide. In fact, the 7.5 percent decline on March 9—which, coincidentally, happens to be the 11th anniversary of the bull market—was the largest since 2008. With a total decline of almost 19 percent, in less than a month, this certainly looks like a crash—doesn’t it?
From the middle of it, perhaps so. It certainly is scary and raises the fear of even deeper declines. The March 9 decline was particularly disconcerting. Looking at the situation with a little perspective, however, things may not seem so scary. We saw a similar drop in December 2018, only to see markets bounce back. We also experienced similar declines in 2011, 2015, and 2016. In every case, it seemed the expansion was over, until the panic passed. It is quite possible that the crash of 2020 will end the same way.
To understand why, let’s look at two things. First, what is driving the current declines? Next, do those declines make sense in the bigger picture?
What’s driving current declines?
The primary story driving the declines so far has been the spread of the coronavirus, COVID-19. The virus started in China and has since spread worldwide. The fear is that it will kill large numbers of people and destroy economies. The headlines, which are all about new cases and policy action such as the shutdown of Italy, seem to validate those concerns.
The facts, however, do not. The best source of updates on the spread of the virus is from Johns Hopkins University. Here, you can find important coronavirus information, especially in the Daily Cases tab (bottom right corner of the page).
As of March 10, 2020 (10:15 A.M.), the Daily Cases chart looked like this:
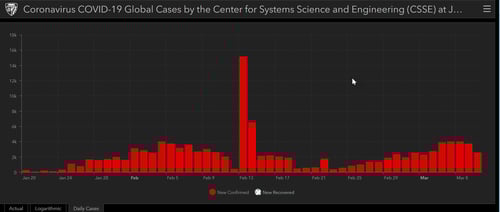
Source: Johns Hopkins University
This chart illustrates the number of daily new cases for the epidemic thus far. You can see the start, a run-up over a period of about four weeks, a stabilization of the number of new cases, and then a decline. The sudden explosion of cases in the middle was the result of a redefinition of how to characterize cases, rather than new cases. Most of these were in China.
Then, starting around February 22, we can see a second wave of cases outside China. Here, again, we see a couple of weeks of increases and then an apparent stabilization in the number of daily new cases—just as we saw in China. As of right now, the expansion of the virus appears to be stabilizing—just as it did in China. Put in this context, seemingly bad news like the lockdown of Italy is really good news, as it is succeeding in containing the spread—just as it did in China. And, if the pattern continues? It tells us we likely have a couple of weeks to go before the epidemic fades—just as it has done in China.
Notably, this chart will also tell us if we need to worry. If new infections just keep rising, that would represent a new development, and one that we should respond to. Until then, however, we need to watch and see if the data continues to improve.
What should investors do?
Given this data, what should investors do? Markets have clearly reacted. So, should we? The natural reaction is to pull back: to de-risk, to sell everything, to end the pain. In fact, that reaction is exactly what has driven the market pullbacks to date. If we do react, however, we face the problem of when to get back into the market. History shows that if we had pulled back in December 2018, we would have missed significant gains, and the same applies to the pullbacks earlier in the recovery.
Looking back at history, we also see this pattern applies to previous epidemics, including the Zika virus, the H1N1 flu, SARS, and MERS. Each virus emerged, exploded around the world, and then faded, with markets panicking and then stabilizing. Most recently, this is the pattern we saw in China itself around the coronavirus, and it is likely the pattern we will see in other markets over the next couple of months. Reacting was the wrong answer. That is likely the case now as well.
When would reacting be the right answer?
There are two ways this situation could evolve to be a real problem for investors. The first is if the virus is not contained, and we talked earlier about how to keep an eye on that risk. The second is if news about the virus really shakes consumer and business confidence, to the point that people stop spending and businesses stop hiring. If that happens, the economic damage could exceed the medical damage, which would certainly affect markets.
The good news here is that, again, the data so far does not show significant damage. Hiring continues to be strong, and consumer confidence remains high. Unless and until that changes, the economy will continue to grow, and the market will be supported. Like the number of new cases, this data will be what we need to watch going forward. Even if we do see some damage—and the likelihood is that we will—markets are already pricing in much of it. Again, the likelihood is that things will not be as bad as expected, which from a market perspective is a cushion.
There may be more downside from here, as significant uncertainty remains. There are also other risks out there. For example, the Saudi oil price cuts, which also rocked the market yesterday, were unexpected. Clearly, there is a lot to worry about, and that might keep pulling markets down.
Even if it does, however, the economic fundamentals remain favorable, which should act to limit the damage—and potentially reverse it, as we have seen before this recovery. Market factors are also becoming increasingly supportive. As valuations drop closer to the lows seen in recent years, further declines become less likely. The markets just went on sale, with valuations lower than we have seen in over a year.
Watch the data, not the headlines
Should we pay attention? Yes, we certainly should—but to the data, not the headlines. As mentioned above, the data on hiring and confidence remains positive, even if the headlines do not. We have seen this show before, an important reminder as we weather the current storm.


