

 Print
Print In yesterday’s post, I pointed out that the markets were taking a break, stopping the sudden slide to think about whether the news surrounding the coronavirus is really as bad as all that. Today, they appear to have decided that, yes, things are that bad and may be even worse. Perhaps, then, it is time for me to reassess my conclusions.
Indeed, I have had some feedback suggesting that I am “dead wrong” and will “eat my words.” Fair enough. Those commenters may be right. The thing is, that is always the case. Any time you make a call, on the best data and analysis you have, you could be wrong. Nothing new here.
Are the facts changing?
As the virus continues to spread, new information about the economic impact comes in, and the markets continue to slide. It makes sense to take this new information into account. A famous Keynes quote is especially apropos here: “when the facts change, I change my mind.” So, are the facts changing?
Short-term risk. One significant fact is. I said yesterday that I use the 200-day moving average as a rough and ready guide to when to pay attention—and the S&P 500 cracked that level earlier today. It has since recovered a bit, but risks of a deeper decline are clearly building. The short-term risk profile has definitely risen.
Long-term risk. The longer-term risk profile, however, has not risen. There are a couple of ways to demonstrate this idea. One is to look at subsequent returns after a pullback like the one we are having, which I covered yesterday. Another is to evaluate how interest rates—a very good proxy for investor fear—behaved in previous epidemic situations.
Lower interest rates on U.S. Treasury securities typically follow increased investor fear. The more fear, the more investors want low-risk securities and the more they will pay for them, lowering the effective rates. The chart below shows the drop in interest rates during previous epidemics and during the current one. It illustrates that we are close to the point of peak fear where previous epidemics bottomed. In other words, this may be close to as bad as it gets.
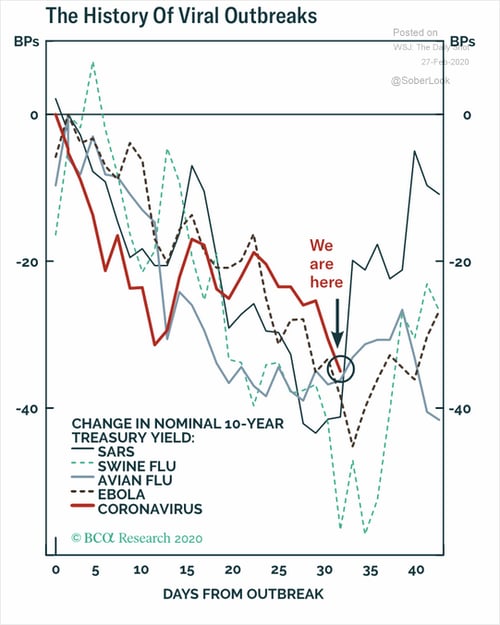
Source: Wall Street Journal Daily Shot
Is this as bad as it gets?
When we look at the new case data, that conclusion seems reasonable. Cases in China peaked a couple of weeks ago and have continued to decline. Despite a slower-than-expected economic recovery, the Shanghai Stock Exchange Index has largely bounced back. Big picture? In China, there is reason to believe the epidemic is being brought under control and that even though the economic damage is real, it is limited. Markets are moving back up as that picture becomes clear. China seems to be behaving just as this chart would suggest.
If the course of the virus in the rest of the world runs like it has in China, then both of the conclusions above—increased short-term risk but moderate longer-term risk—make sense. Cases in the rest of the world are still expanding and are not yet under control. Until that happens, we may well see continued market declines. Once the virus has been controlled, however, economies and markets will adjust to the new reality, which is very likely to be less bad than it might have been.
Are things different this time?
The key assumption behind those calling this the knell of doom is that the coronavirus is somehow different from, and more dangerous than, previous epidemics. That somehow this virus will change everything. In other words, that it is different this time.
Maybe so. If it is, though, we should know in a couple of weeks. Right now, the data is saying this is not all that different and, therefore, won’t be different this time. Fortunately, what that means is that we can expect the virus to be brought under control—as it seems to have been in China—and that the world economies and markets will carry on.
So, have I changed my mind?
Going back to the initial question of whether I’ve changed my mind, the answer is, “not really.” But I am prepared to do so when the data suggests I need to. Right now, it doesn’t.
There are really three takeaways here. First, we may well see more risk and market pullbacks in the short term. Expect that. Second, in the longer term, the risks remain moderate. As such, remain calm and carry on continues to be the best strategy, but we should continue to evaluate the data to see if things really have changed.
Stay safe out there!


