

 Print
Print It’s that moment you’ve all been waiting for—the 2018 Bubble of the Year Award (“the Bubby”)! This long-standing tradition (as of last year) brings together the strongest and weakest investment stories for a no-holds-barred match to see which stands out as the bubble of the year. This year, we have several strong contestants.
2017 champ
Our defending champion is bitcoin. It showed a remarkable run through the year, starting high and ending low. The decline (from the high to this writing) was a startling 78 percent. Clearly, bitcoin still has a reason to be in the running. Declines like this are indeed characteristic of a memorable bubble.
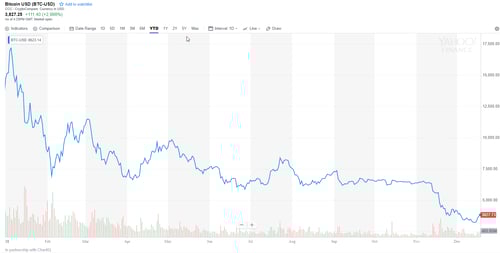
Source: Yahoo! Finance (as of December 19, 2018)
But despite this truly noteworthy performance, are there other candidates that had an even better claim?
Last-minute contenders
As a last-minute entry, the U.S. stock market made a strong bid for inclusion with declines at the end of the year. Despite that effort, however, the total decline—at just over 10 percent from the highs—simply doesn’t fall into bubble territory. In fact, so far at least, this is just a normal drop and nothing to worry about. Nice try, stock market. No bubble here.
Parts of the stock market, however, made an even stronger case. One dark-horse entrant, the marijuana industry, wasn’t even on the radar at the start of the year. With the listing of several companies, however, and with high (ahem!) investor interest, we saw a dramatic introduction—followed by a dramatic decline.
You can see this spike and decline clearly in one of the marquee stocks in the industry. Investors got incredibly excited and bid up the stock, only to see it then cool down. Another strong contender for the Bubby. The problem, though, is that the decline, at about 65 percent, is well below that of bitcoin. Still, in terms of appreciation, no one else has come close this year, and that initial pop is what truly makes a bubble stand out.
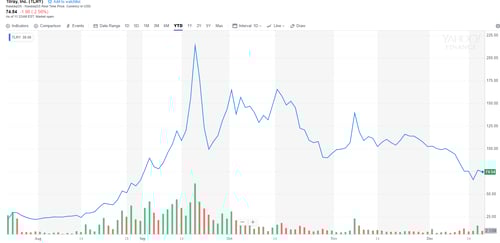
Source: Yahoo! Finance (as of December 19, 2018)
To try to clarify, we can compare the two on a percentage basis. The chart below shows the changes since just before the marijuana stock was offered. Bitcoin doesn’t even really register on a chart, which shows gains of more than 800 percent and the subsequent decline. Most of bitcoin’s gains came last year. While there has been a steady decline since then, the chart clearly shows that bitcoin was last year’s bubble—not this year’s.
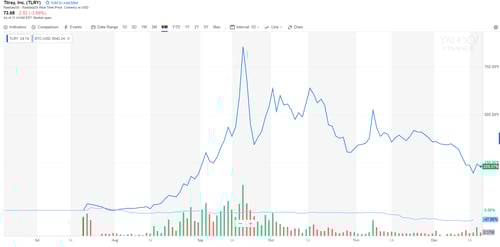
Source: Yahoo! Finance (as of December 19, 2018)
The envelope please. . .
Without further ado, the 2018 Bubble of the Year Award goes to the marijuana industry for its astonishing spike and equally astonishing subsequent drawdown. (Wild applause from the audience.) Congratulations!
With bitcoin showing signs of a rally and with marijuana still elevated from the starting point, it is clear that these two may well be in contention again in 2019—joined no doubt by another candidate we don’t yet know about. Join us next year for another wonderfully exciting competition!
A cautionary tale
I enjoy doing this post, and thanks to the readers who wrote in with nominations. Keep them coming! On a more serious note, by looking at bubbles—what drives them and how they break—we can help ourselves as investors avoid some fairly predictable mistakes. The point of this post, beyond entertainment, is education. Even successful investments, which both bitcoin and the marijuana industry may well end up, can be severely overpriced. We, as investors, need to be conscious of value, not just price. Bubbles offer that cautionary tale on a regular basis.


