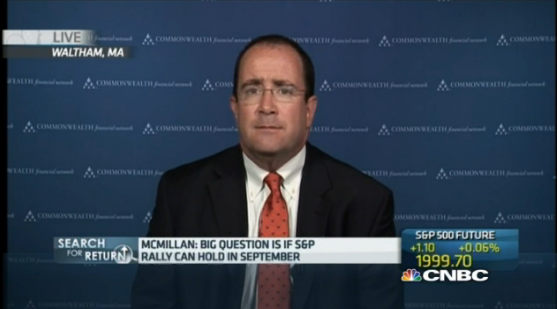
What do I think about the S&P 500's break above 2,000? Hear what I discussed with CNBC Worldwide Exchange in an interview today, August 27.
August 27, 2014
What do I think about the S&P 500's break above 2,000? Hear what I discussed with CNBC Worldwide Exchange in an interview today, August 27.
The S&P 500 has set another record, closing above 2,000 for the first time yesterday. Hooray.
I want to be excited, I really do. But I just can’t get there, and I don’t seem to be alone. The press has noted it, without much fanfare. The market itself doesn’t seem all that jazzed.
Why the ennui? I suspect it’s because this may not be a real rally, but one driven by low volumes, senior staff on vacation, and other less-than-exciting factors. After Labor Day, we should get a better look at what investors really think.
Looking into the relationship between interest rates and stock market valuations, I’ve found two very interesting points that have a direct bearing on our investments.
First, the valuation metric you use matters. As you may remember, I prefer a cyclically adjusted price/earnings ratio, or Shiller P/E, over a P/E based on only 12 months of data. When you compare the relationships with interest rates, among other factors, it’s very clear that the Shiller P/E has the better economic foundation; not only is it more intuitively sensible, it’s also a better analytical tool.
August 25, 2014
As we discussed last week, market crashes (defined as drops of 30 percent or more) have become more common recently, while the smaller declines known as bear markets (drops of about 20 percent) have become less so. With two major crashes in the past 10 years, it seems like a good idea to examine some of the factors that preceded them.
Are there any warning signs that we should be keeping an eye out for?
August 22, 2014
Yesterday, we talked about the latest prediction of doom—this time, a 67-percent decline in the stock market in the next 18 to 24 months. Unlike most doom-saying, which isn’t supported by any actual data (the collapse of the dollar, for example), arguments for a significant market decline are based on a number of very real facts, many of which I’ve discussed in the past.
I've never really examined the situation of a crash itself, however. What would a crash mean, and how would it likely play out?
August 21, 2014
Yesterday, I received a question from Joe Esposito that touches on some very relevant demographic-related issues:
“How do you feel about Harry Dent's prediction of a Dow 5,500 and the next big crash starting within the next 24 months or so? Just curious on your take regarding his demographic viewpoints and positioning with booms and busts. (Highs are higher and busts will be lower than that last.) Thoughts?”
August 20, 2014
When I speak to groups in various parts of the country, I often hear that things there don’t reflect the national employment averages and trends I talk about. This usually leads to some interesting discussions about why that might be the case.
The problem with looking at region-specific trends is the lack of research in that area. So I was glad to discover a recent report by Deloitte University Press that breaks out some numbers on a regional basis, with interesting results.
August 19, 2014
One of the advantages of a slow summer season is that we can spend some time on topics that are important but not urgent. Demography is a great example. It determines most of the context in which the economy operates, but its trends play out over years and decades. Like the weather, demographic trends are just there, and we have to adjust to them.
Simply looking at the U.S. population distribution can give us some insight into what will happen over the next 20 years or so, as well as what’s happening right now.
August 18, 2014
As I wrote in my last post, oil prices have stayed lower for longer than many would have expected, and we may see prices drift lower still as supply continues to outpace demand.
Some of the effects of lower prices are obvious, but others aren’t. Let's take a look at who stands to benefit from continued low prices—and who may not fare so well.
August 15, 2014
As I write, the financial markets are dropping on fears that the situation in Ukraine is about to escalate. This doesn’t come as a surprise, and, frankly, it’s not very interesting from an economic point of view.
More striking is that oil prices have continued to decline despite this turmoil and everything else that’s happening around the world, particularly in Gaza and Iraq. Down more than 2 percent this morning, crude prices are at monthly and quarterly lows, and they're getting very close to annual lows as well.
Episode 11
September 10, 2025
Episode 10
August 13, 2025
Episode 9
July 23, 2025
Episode 8
June 18, 2025
Episode 7
May 14, 2025
The information on this website is intended for informational/educational purposes only and should not be construed as investment advice, a solicitation, or a recommendation to buy or sell any security or investment product. Please contact your financial professional for more information specific to your situation.
Certain sections of this commentary contain forward-looking statements that are based on our reasonable expectations, estimates, projections, and assumptions. Forward-looking statements are not guarantees of future performance and involve certain risks and uncertainties, which are difficult to predict. Past performance is not indicative of future results. Diversification does not assure a profit or protect against loss in declining markets.
The S&P 500 Index is a broad-based measurement of changes in stock market conditions based on the average performance of 500 widely held common stocks. All indices are unmanaged and investors cannot invest directly in an index.
The MSCI EAFE (Europe, Australia, Far East) Index is a free float‐adjusted market capitalization index that is designed to measure the equity market performance of developed markets, excluding the U.S. and Canada. The MSCI EAFE Index consists of 21 developed market country indices.
One basis point (bp) is equal to 1/100th of 1 percent, or 0.01 percent.
The VIX (CBOE Volatility Index) measures the market’s expectation of 30-day volatility across a wide range of S&P 500 options.
The forward price-to-earnings (P/E) ratio divides the current share price of the index by its estimated future earnings.
Third-party links are provided to you as a courtesy. We make no representation as to the completeness or accuracy of information provided on these websites. Information on such sites, including third-party links contained within, should not be construed as an endorsement or adoption by Commonwealth of any kind. You should consult with a financial advisor regarding your specific situation.
Member FINRA, SIPC
Please review our Terms of Use.
Commonwealth Financial Network®