

 Print
Print One of the advantages of a slow summer season is that we can spend some time on topics that are important but not urgent. Demography is a great example. It determines most of the context in which the economy operates, but its trends play out over years and decades. Like the weather, demographic trends are just there, and we have to adjust to them.
Simply looking at the U.S. population distribution can give us some insight into what will happen over the next 20 years or so, as well as what’s happening right now.
Labor force declines, boosting wages
In this chart from 361 Capital, you can see the first wave of baby boomers moving past 65, which explains the consistent drop in the labor participation rate. You can also see the larger population groups that will be aging out of the labor force soon, pushing the participation rate down further, even as the economy improves.
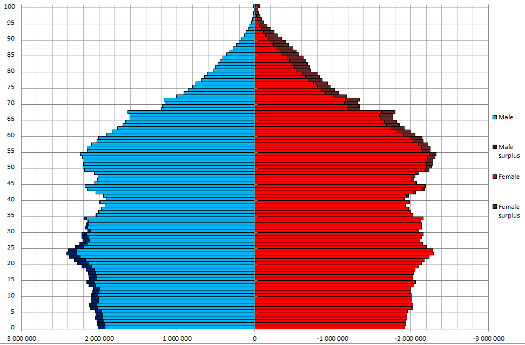
This trend should intensify for the next 10 years before moderating, but it’s not necessarily an indication of a weak labor market. In fact, a declining labor force should result in historically low unemployment rates, which may drive both wages and inflation higher as companies compete for workers.
From a labor supply standpoint, the situation doesn’t look much better when we consider the rising generation. We’re already seeing the largest growth in population from the echo boomers moving into the labor force, at ages 23–25, and this growth is set to decline, as the groups slightly younger are smaller.
From a business perspective, a declining labor force is bad news, but from a worker perspective it’s a plus. Over the past five to ten years, both the baby boomers and echo boomers have been in the job market at the same time. Unsurprisingly, given the large labor force, unemployment has been high and wages constrained. The financial crisis, of course, made the situation worse. Now, with both those trends reversing and the economy normalizing, wages should grow more quickly.
Consumer spending slows as boomers age
Now, let’s combine the demographic trends discussed above with historical spending patterns by age to see what we can expect for the economy as a whole. As you can see in the chart below (from Goldman Sachs via 361 Capital), baby boomer spending is moving past its peak as the largest cohort ages out past 55, into a lower spending trend.
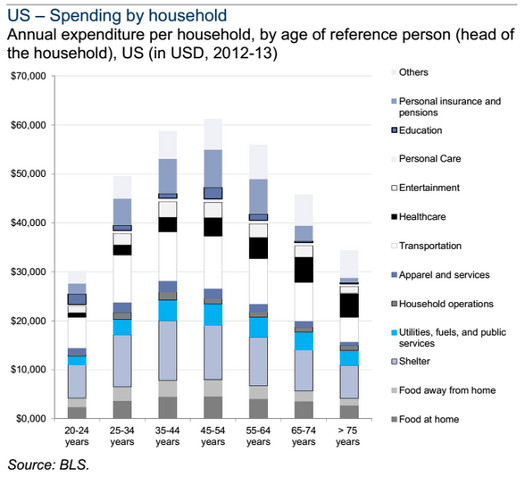
The loss in baby boomer spending will not be offset, at least for the next 10 years or so, by the echo boomers, who are just moving into the 25–34 tranche, and whose spending will still be significantly less. Consumer spending can reasonably be expected to grow more slowly than it has in the past, with saving rising as boomers transition (finally!) into preparing for retirement.
In fact, this is exactly what we’re seeing now. Despite growing employment and wage income, growth in personal spending has stayed very low by historical levels over the past five years—just what we would expect given the demographic transition under way.

We see the same effect in personal savings rates, per the following chart. After decades of decline, they show signs of returning to higher levels.
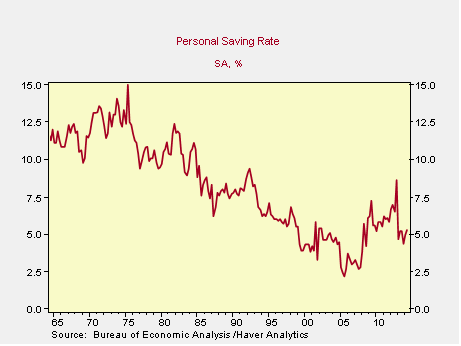
The thing about demographics is that there’s very little uncertainty. All of the babies included in the current data have already been born. Any uncertainty relates to how they will behave. Here, the signs are that the echo boomers will spend less than the boomers. Given the past five years, it would be surprising if they didn't behave that way, and I suspect consumption patterns will normalize with the economy.
Economy primed to expand
The takeaway here is that many of the trends currently being decried are, in fact, predictable outcomes of the way the population is changing over time. Faster wage growth can mesh very well with rising savings rates, and, overall, the economy looks well positioned to continue its expansion.


