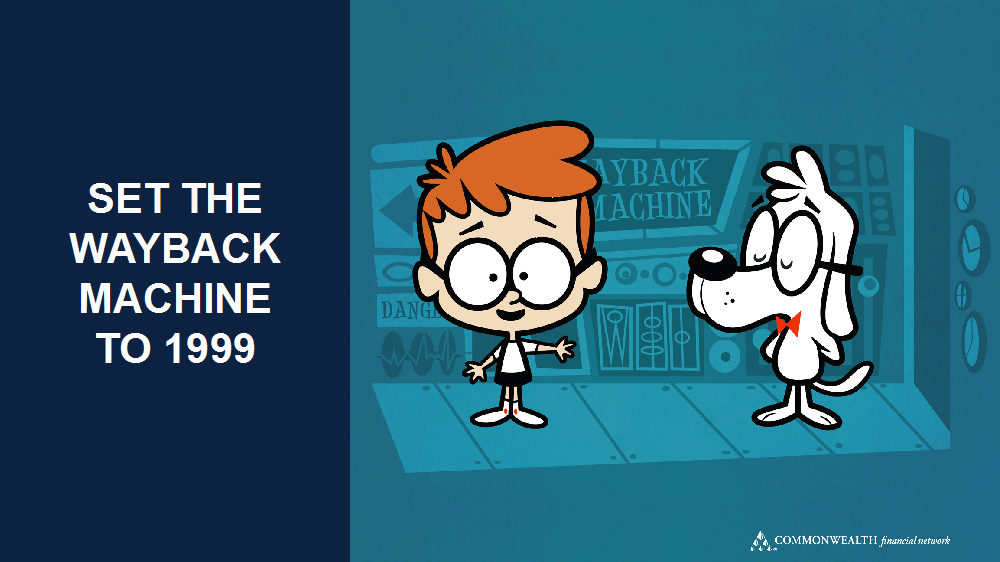
The Independent Market Observer

A Reminder About the Big Picture

May 16, 2017

Looking back over the past couple of weeks, my overall approach has been one of looking at the big picture rather than the details. And when you do that, the big picture is actually quite good. In many ways, we are in a boom time like we haven’t seen since the 1990s. I know that goes substantially against the narrative out there, and there are important differences. But there are also more similarities than you might expect given the news coverage.

Continue reading → Leave a comment

Monday Update: Inflation Low, Confidence and Spending Up

May 15, 2017

Last week’s data was positive, reversing concern about consumer spending and suggesting consumer confidence remains strong. Lower inflation results were noteworthy but not of immediate worry. Overall, the data suggests that the slowdown in the first quarter is likely to get better—possibly significantly—over the next couple of months.

Continue reading → Leave a comment

Is China Throwing Out Recession Signals?

May 12, 2017

After writing yesterday’s post, it occurred to me that it would make sense to apply the measures I use for the U.S. to other economies where problems could affect us. Interestingly enough, just as I thought that, articles pointed out that one of my key metrics—the yield curve, which represents how much central banks are stimulating an economy—had just flashed a trouble signal in China.

Continue reading → Leave a comment

Distinguishing Between Signals and Noise

May 11, 2017

I have written about this concept before, but given some conversations I’ve had recently, I think it’s a great time to revisit it. When trying to understand both what is happening and (ideally) what is going to happen, we need to be able to identify what is important—and what is not. In other words, what signals should we pay attention to—and what noise should we ignore?

Continue reading → Leave a comment

Monthly Market Risk Update: May 2017

May 10, 2017

Just as I do with the economy, I review the market each month for warning signs of trouble in the near future. Although valuations are now high—a noted risk factor in past bear markets—markets can stay expensive (or get much more expensive) for years and years, which doesn’t give us much to go on timing-wise.

Continue reading → Leave a comment

Economic Risk Factor Update: May 2017

May 9, 2017

Economic data in April was mixed, with first-quarter weakness lingering in some risk indicators. Overall, though, the news was positive, and most forward-looking indicators we track bounced back from decreases in March. Given the good news in the employment and service sectors, two of the indicators here, it is very likely that the weakness in the first quarter, including March, was seasonal rather than the start of a negative trend. As a result, all of our indicators remain in green-light territory.

Continue reading → Leave a comment

Monday Update: Outlook Positive Despite Mixed Results

May 8, 2017

Last week’s data was mixed, with two areas of concern, but it also included significant positive surprises. Overall, results suggest the slowdown in the first quarter is likely to get better, possibly a lot better, over the next couple of months.

Continue reading → Leave a comment

Economic Slowdown Averted?

May 5, 2017

We’ve been seeing mixed data on the economy lately—even some signs that a slowdown might be under way. But was the slowdown real, or was it just another slow first quarter, which has been the norm for the past couple of years? A weak set of data for March raised concerns even higher, and this week was going to help us confirm what was really going on.  

As of today, it looks like predictions of the recovery’s death have been exaggerated once again.

Continue reading → Leave a comment

Markets and U.S. Politics: Time + Distance = A Different Perspective

May 4, 2017

Warren Buffett has said that he finds living in Omaha to be an advantage, as it distances him from much of the daily noise of the financial markets. Since I’ve been in Hungary at a conference this week, I’m starting to understand what he means.

Continue reading → Leave a comment

A Week in Budapest

May 3, 2017

I’m in Budapest, Hungary, this week at the Commonwealth Leaders Conference. As always, it's great to spend time with such a fantastic group of financial advisors. It is an enormous privilege to be here.

Continue reading → Leave a comment

Subscribe via Email

AI_Community_Podcast_Thumb - 1


Episode 11
September 10, 2025

Episode 10
August 13, 2025

Episode 9
July 23, 2025

Episode 8
June 18, 2025

Episode 7
May 14, 2025

More


Hot Topics


New Call-to-action

Archives

see all

Subscribe


Disclosure

The information on this website is intended for informational/educational purposes only and should not be construed as investment advice, a solicitation, or a recommendation to buy or sell any security or investment product. Please contact your financial professional for more information specific to your situation.

Certain sections of this commentary contain forward-looking statements that are based on our reasonable expectations, estimates, projections, and assumptions. Forward-looking statements are not guarantees of future performance and involve certain risks and uncertainties, which are difficult to predict. Past performance is not indicative of future results. Diversification does not assure a profit or protect against loss in declining markets.

The S&P 500 Index is a broad-based measurement of changes in stock market conditions based on the average performance of 500 widely held common stocks. All indices are unmanaged and investors cannot invest directly in an index.

The MSCI EAFE (Europe, Australia, Far East) Index is a free float‐adjusted market capitalization index that is designed to measure the equity market performance of developed markets, excluding the U.S. and Canada. The MSCI EAFE Index consists of 21 developed market country indices.

One basis point (bp) is equal to 1/100th of 1 percent, or 0.01 percent.

The VIX (CBOE Volatility Index) measures the market’s expectation of 30-day volatility across a wide range of S&P 500 options.

The forward price-to-earnings (P/E) ratio divides the current share price of the index by its estimated future earnings.

Third-party links are provided to you as a courtesy. We make no representation as to the completeness or accuracy of information provided on these websites. Information on such sites, including third-party links contained within, should not be construed as an endorsement or adoption by Commonwealth of any kind. You should consult with a financial advisor regarding your specific situation.

Member FINRASIPC

Please review our Terms of Use

Commonwealth Financial Network®