 Following up on last week’s post about real risks and the opportunities that could arise from them, let’s take a look at the energy industry. With oil prices dropping to multiyear lows, companies and countries struggling to stay in business and pay their bills, and new suppliers like Iran reentering the market, the industry has been in better shape.
But could this slump also present opportunities? Let’s consider two of the biggest concerns about low oil prices. As in many other cases, looking at actual data can provide the context to help us move beyond the fear.
Do low prices signal global disaster?
The narrative is that oil prices are unsustainably low, at levels that cannot possibly continue. With prices where they are, the argument goes, the world economy must be in trouble. But is this really true?
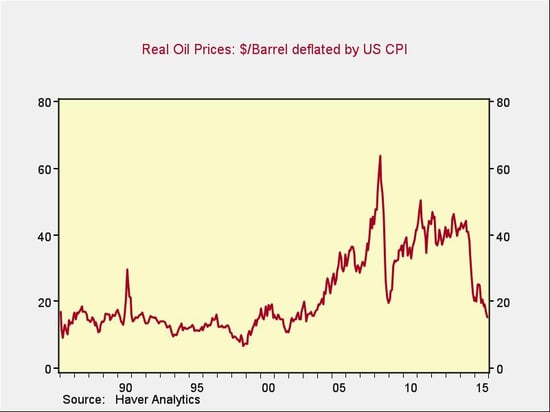
The chart below shows real oil prices—that is, oil prices adjusted for the effects of inflation.

My takeaway is that current prices are much more consistent with the 20 years from 1985 to 2005 than with prices since 2005, when we saw a sustained move upward. Given the consistency of real prices from 1985 through 2005, it’s hard to argue that a return to those levels is necessarily a prescription for global disaster. Putting today’s prices in context, we can see that concerns about an economic apocalypse may be misplaced.
Although the adjustment period is certainly turbulent, it was possible for economies to grow for decades with prices at this level.
Is this an unprecedented drop?
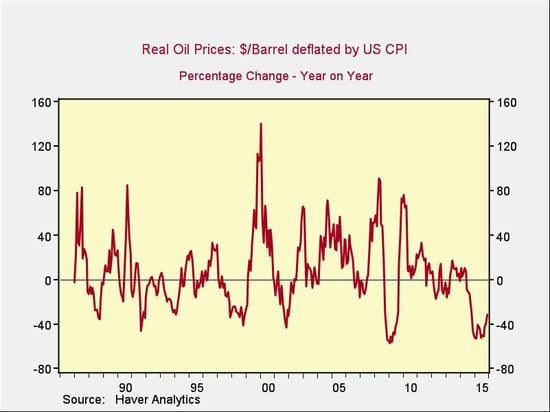
The second major concern is that we’ve never before seen this kind of drop in oil prices. Again, let’s take a look at the data. The following chart shows year-on-year changes in the real oil prices from the previous chart over the past 30 years.

In fact, though the current decline is exceptionally severe, it is comparable with many other price drops, including those of 2009, 2002, 1999, 1991, and 1989.
We can draw two conclusions from this chart:
- First, the bottom of the price decline is typically about a year after a significant economic slowdown or market decline. In other words, the decline does not lead such an event, it follows it. If this drawdown is typical, the bottom in oil prices means that the worst economic and market weakness may be behind us, not in front of us.
- Second, in every similar decline there was a spike, in the next year or so, of at least 30 percent—and usually much more—as markets normalized. Again, if the oil market behaves like it has in the past, we can expect prices to move sharply higher over the next couple of years.
Is this a guarantee? Of course not. But, if we consider that oil is now at a price level that has been sustainable for decades, the possibility of global economic collapse isn’t as much of a concern—and the idea of a price recovery seems more reasonable. And if we consider that price drops like this one are not unprecedented (and not even uncommon), it frees us to consider the next step.
History suggests that the next step is a price recovery, and probably a substantial one. Such a recovery could return prices to levels that are still economically stimulative while also bringing the energy sector back to life. With prices where they are now, that looks to me like a very real opportunity.


 Print
Print


