Print
Print My colleague Sam Millette, senior investment research analyst on Commonwealth’s Investment Management and Research team, has helped me put together this month’s Market Risk Update. Thanks for the assist, Sam!
April saw markets rebound from the recent lows set in March, as progress combating the spread of the coronavirus gave hope to investors. The S&P 500 gained 12.82 percent during the month, marking the best single month for the index since 1987. While this swift rebound was quite welcome for investors, very real risks to markets still remain—and there are several key factors that matter when determining the overall risk level.
Recession risk
Recessions are strongly associated with market drawdowns. Indeed, 8 of 10 bear markets have occurred during recessions. As we discussed in this month’s Economic Risk Factor Update, right now the conditions that historically have signaled a potential recession are likely here. On an absolute basis, all of the major economic indicators that we cover monthly are now at a red light. As such, we have kept the economic factors at a red light for May.
Economic shock risk
There are two major systemic factors—the price of oil and the price of money (better known as interest rates)—that drive the economy and the financial markets, and they have a proven ability to derail them. Both have been causal factors in previous bear markets and warrant close attention.
The price of oil. Typically, oil prices cause disruption when they spike. This is a warning sign of both a recession and a bear market. In this case, however, the sudden drop is also a warning of significant disruption.
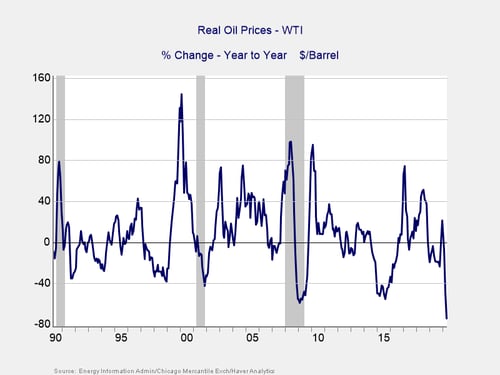
The price of oil fell by nearly 74 percent on a year-over-year basis in April, as lowered global demand continued to keep prices low during the month. This is the largest year-over-year decline on record, highlighting the effect that lowered demand has had on prices. The average price of oil fell from $26.46 in March to $16.61 in April, marking the largest monthly decline on record. This brought the average price of oil to its lowest level since 1999. Typically, lowered gas prices are a boon to consumers; however, with much of the country sheltering at home and limiting travel, the benefit was likely minimized during the month.
Going forward, sustained oil prices at these levels signal a risk, with the energy industry being massively disrupted, as we saw back in 2015. While lower prices would normally have also generated an offsetting stimulus, as consumers spend less to drive, the shutdown of the economy has eliminated that. Given the continued weakness in prices in April, we’ve downgraded this indicator to red.
Signal: Red light
The price of money. We cover interest rates in the economic update, but they warrant a look here as well.
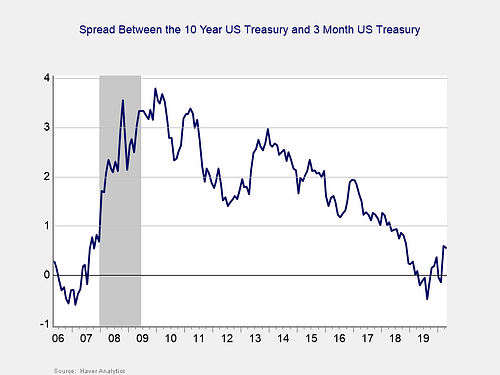
After spending the fourth quarter un-inverted, the yield curve briefly re-inverted in January through February, un-inverted again in March, and remained un-inverted in April. This un-inversion was driven by a sharp drop in short-term rates, which in turn was caused by the Fed’s decision to cut the federal funds rate to effectively zero percent in March. The yield on the 3-month Treasury remained largely range bound in April, falling from 0.11 percent at the end of March to 0.09 percent at the end of April. The 10-year yield also declined slightly during the month, down from 0.70 percent to 0.64 percent.
While an inversion is a good signal of a pending recession, it is when the gap subsequently widens to 75 bps or more that a recession becomes imminent—which is what happened in 2008 and what has just about happened again. With the spread near the critical level, we are leaving this indicator at a red light. In conjunction with other monetary and fiscal policy actions, the current spread levels clearly represent a risk.
Signal: Red light
Market risk
Beyond the economy, we can also learn quite a bit by examining the market itself. For our purposes, two things are important:
- To recognize what factors signal high risk
- To try to determine when those factors signal that risk has become an immediate, rather than theoretical, concern
Risk factor #1: Valuation levels. When it comes to assessing valuations, we find longer-term metrics—particularly the cyclically adjusted Shiller P/E ratio, which looks at average earnings over the past 10 years—to be the most useful in determining overall risk.
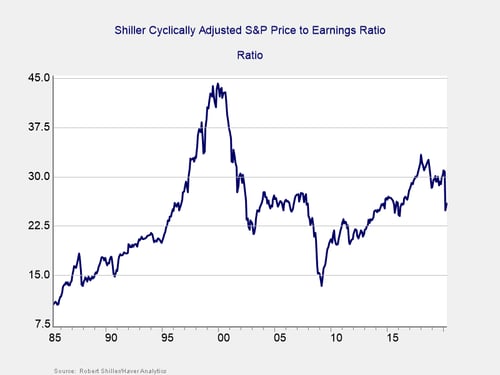
Valuations increased modestly in April, from 24.9 in March up to 25.88 in April. This follows a steep drop from 30.79 in February. Valuations now sit at levels last seen in early 2016, which indicates that risks still remain, despite the volatility in March and subsequent rebound in April. Overall, valuations remain high compared with historical norms.
Even as the Shiller P/E ratio is a good risk indicator, however, it is a terrible timing indicator. To get a better sense of immediate risk, we can turn to the 10-month change in valuations. Looking at changes, rather than absolute levels, gives a sense of the immediate risk level, as turning points often coincide with changes in market trends.
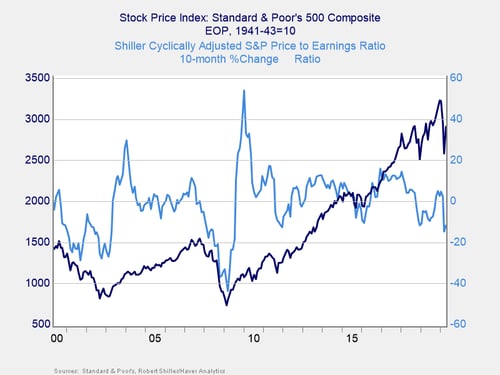
Here, you can see that when valuations roll over, with the change dropping below zero over a 10-month or 200-day period, the market itself typically drops shortly thereafter. This relationship held in March, as valuations and the index both rolled over during the month before partially rebounding in April.
Given the rebound in valuations and markets during the month, we’ve upgraded this signal to a yellow light for now, with a downgrade to red possible if volatility picks up in May.
Signal: Yellow light
Risk factor #2: Margin debt. Another indicator of potential trouble is margin debt.
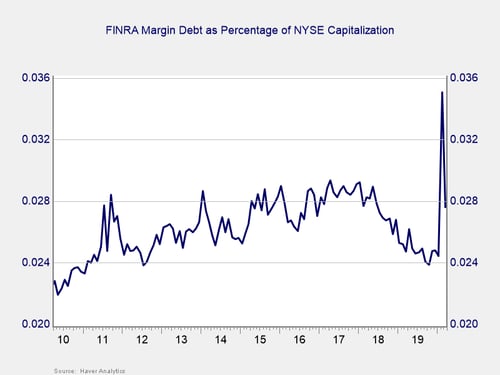
Debt levels as a percentage of market capitalization had dropped substantially over the past two years, to close to the lowest levels of the recovery, before spiking dramatically in February to an all-time high on the market decline. The March rebound saw this measure of market debt come back down, but only to levels last seen in 2018. Despite the pullback in March, margin debt remains very high on a historical level.
For immediate risk, changes in margin debt over a longer period are a better indicator than the level of that debt. Consistent with this, if we look at the change over time, spikes in debt levels typically precede a drawdown.
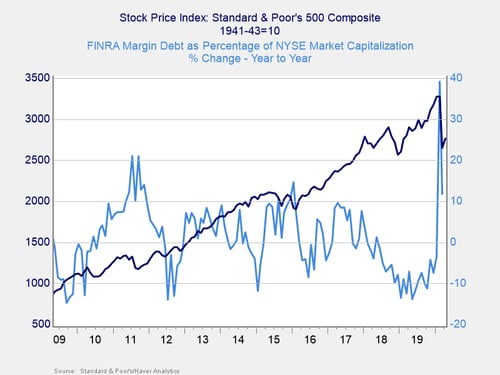
As you can see in the chart above, the annual change in debt as a percentage of market capitalization increased dramatically in February, before coming back partially in March. Despite the pullback during the month, this indicator is still signaling immediate risk due to the double-digit year-over-year growth. Given that, and the fact that the overall debt level remains high historically, it is worth watching. So, we are keeping this indicator as a red light.
Signal: Red light
Risk factor #3: Technical factors. A good way to track overall market trends is to review the current level versus recent performance. Two metrics we follow are the 200- and 400-day moving averages. We start to pay attention when a market breaks through its 200-day average, and a break through the 400-day often signals further trouble ahead.
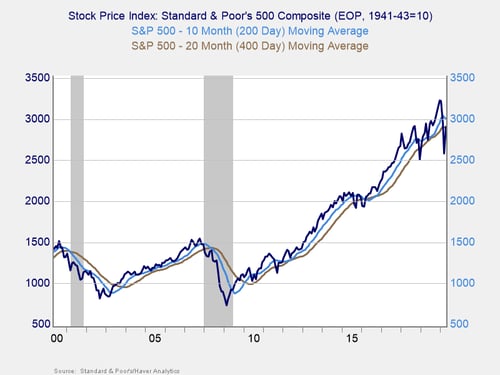
Technical factors for U.S. markets were mixed during the month. The S&P 500 and Dow Jones Industrial Average both spent April under their respective 200-day moving averages, although they moved notably closer to the trend line by month-end. The S&P 500 was even able to break above its 400-day moving average by month-end. The Nasdaq was the only major U.S. equity market to finish April above its 200-day moving average.
The 200-day trend line is an important technical signal that is widely followed by market participants, as prolonged breaks below this trend line could indicate a longer-term shift in investor sentiment for an index. The 400-day trend line is also a reliable indicator of a change in trend. As we saw in April, the S&P 500 was unable to rally above its 200-day moving average; however, the fact that it broke above the 400-day trend line is encouraging. Despite the rebound in April, we’ve kept this signal at a red light given the fact that the S&P 500 remained below its 200-day moving average at month-end.
Signal: Red light
Conclusion: Market risks remain despite April rebound
Economic fundamentals worsened during the month; however, markets proved to be exceptionally resilient, as investors drew confidence from continued progress in combating the spread of the coronavirus. Despite the rebound for markets during the month, real risks to markets still remain, highlighted by high historical valuation levels and mixed technicals.
March’s downturn was driven not just by a breakdown in fundamentals but also by increased fear around the spread of the coronavirus. Therefore, the partial market recovery in April makes sense given the progress we made as a country in combating the coronavirus during the month. With that being said, markets are currently pricing in a swift economic recovery, and there is no guarantee that will be the case. In fact, with certain states beginning the opening-up process in May, we may see further spread of the coronavirus in the near future. Ultimately, if efforts to combat the spread of the coronavirus meet any significant headwinds, further market volatility is likely.
As such, we are keeping the overall market risk indicator at a red light. This is not a sign that markets are headed for another significant drop. Instead, it is a recognition that the path back to normal is likely going to be longer than markets seem to expect, with the potential for setbacks that could lead to additional market pullbacks. Given the uncertainty created by the pandemic and the likelihood for further volatility, equity market risks remain high despite recent outperformance.