Print
PrintMy colleague Sam Millette, senior investment research analyst on Commonwealth’s Investment Management and Research team, has helped me put together this month’s Economic Risk Factor Update. Thanks for the assist, Sam!
The economic data releases in April continued to highlight the devastating effect that measures to combat the coronavirus have had on the economy. While some of the individual reports came in above expectations, those results were due to sharply lowered forecasts rather than better real economic outperformance. All of the major economic indicators we follow in this piece are now at a red light level and are likely to remain so for the immediate future. We are quite likely in the midst of a recession, and the worsening data highlights the very real damage that has been done to the economy over the past two months.
In this edition of the Economic Risk Factor Update, we have extended the time frame in the charts to include the collapse in 2008. This extension provides valuable context about the depth and timing of the current downturn, and it will provide some guidance once the data starts to turn more positive.
The Service Sector
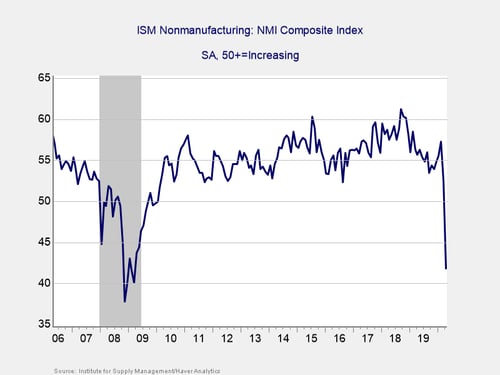
Signal: Red light
This measure of service sector confidence fell by less than expected during the month, declining from 52.5 in March to 41.8 in April, against expectations for a larger fall to 38. Despite the better-than-expected result, this drop brought the index to its lowest level in more than a decade and close to the nadir during the last crisis, as service sector confidence now sits near the all-time low of 37.8 set in November 2008. This is a diffusion index, where values below 50 indicate contraction. So, this drop is concerning, although not necessarily surprising given the shutdowns to most businesses during the month. Going forward, the declines we saw in business confidence during the month are a bad sign for future business investment, which was already weak heading into 2020. Given the continued weakness in service sector confidence, we are leaving this indicator at a red light.
Private Employment: Annual Change
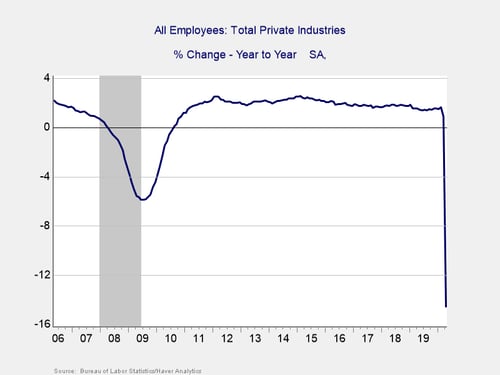
Signal: Red light
April’s employment report showed the devastating impact that wide-scale shelter-in-place orders had on the jobs market, with 20.5 million jobs lost during the month. This result was better than economist estimates for 22 million lost jobs, but previously released unemployment claims data indicates that this report may be undercounting the full extent of the damage. Despite the better-than-expected results for headline job losses, April represents the worst single month for American job losses since the Second World War. Given the historically bad result for headline jobs during the month, we are keeping this indicator as a red light.
Private Employment: Monthly Change
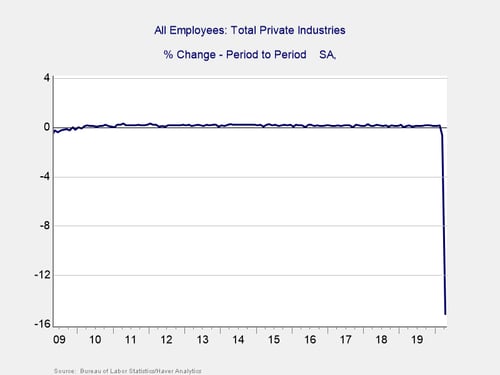
Signal: Red light
These are the same numbers as in the previous chart but on a month-to-month basis, which can provide a better short-term signal. The pace of month-over-month job growth dropped sharply in April, with the number of jobs falling by more than 15 percent. This drop represents the largest monthly decline since records began in 1939. The underlying data was also weak, as the unemployment rate increased to a post-war high of 14.7 percent, against expectations for an increase to 16 percent. This brought the unemployment rate well above the recent high of 10 percent that was seen during the great financial crisis, and there is evidence that misclassification of some workers kept the reported unemployment rate artificially low. Given the massive disruption to the job market in April and anticipated future headwinds, we have kept this signal at a red light.
Yield Curve (10-Year Minus 3-Month Treasury Rates)
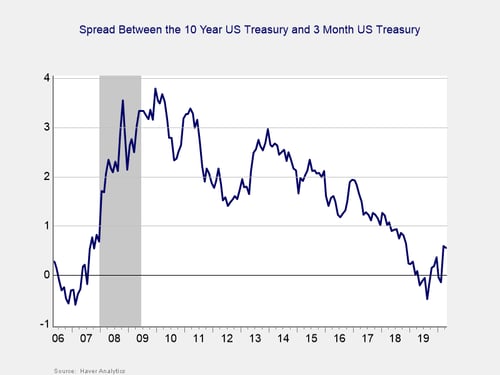
Signal: Red light
After spending the fourth quarter un-inverted, the yield curve briefly re-inverted in January through February, un-inverted again in March, and remained un-inverted in April. This un-inversion was driven by a sharp drop in short-term rates, which in turn was caused by the Fed’s decision to cut the federal funds rate to effectively zero percent in March. The yield on the 3-month Treasury remained largely range bound in April, falling from 0.11 percent at the end of March to 0.09 percent at the end of April. The 10-year yield also declined slightly during the month, down from 0.70 percent to 0.64 percent.
While an inversion is a good signal of a pending recession, it is when the gap subsequently widens to 75 bps or more that a recession becomes imminent—which is what happened in 2008 and what has just about happened again. With the spread near the critical level, we are leaving this indicator at a red light. In conjunction with other monetary and fiscal policy actions, the current spread levels clearly represent a risk.
Consumer Confidence: Annual Change
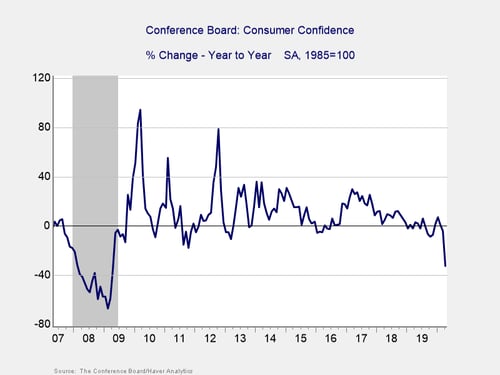
Signal: Red light
Confidence declined from a downwardly revised 118.8 in March to 86.9 in April, a drop of 31.9 points. This drop, which was worse than the expected decline to 87, represents the worst monthly decline since oil was embargoed in 1973. On a year-over-year basis, confidence declined by roughly 32.7 percent. This disappointing but unsurprising result brought the index to its lowest level since 2014.
The decline in headline confidence was caused by a sharp drop-off in the present-situation subindex, which fell from 166.7 in March to 76.4 in April. Given the unprecedented number of layoffs over the past two months, as well as the continued efforts to combat the spread of the coronavirus, weak confidence is expected going forward.
This report bears watching, as hopes for a V-shaped economic recovery will likely hinge on a swift rebound in consumer confidence and spending figures. At the moment, the annual decline is well below the 20 percent that historically has indicated a recession and is unlikely to recover any time soon. Given that gap, we have downgraded this indicator to a red light.
Conclusion: Economy likely in recession
While some of the April releases came in slightly better than expected, these outcomes were primarily driven by cratering economist expectations rather than a meaningful pickup in economic activity. The overall picture is of an economy that is turning down sharply from the headwinds created by the current anti-coronavirus measures. This is a swift change from the first two and a half months of the year, where we saw largely improving economic data. These earlier results helped cushion some of the initial fall in economic activity in March; however, the worsening fundamentals in April point to a continued slowdown until further progress is made in containing the coronavirus and returning closer to pre-pandemic activity levels.
Ultimately, this was a month that showed quite clearly the full impact that a large external shock can have on the economy. Both on a monthly and year-over-year basis, the reports point toward an economy that is likely in the midst of a recession. Given the weakening economic fundamentals during the month and the anticipation of further pressure from the measures to combat the coronavirus, we are leaving the overall risk level at a red light for the economy as a whole for May.