Print
Print My colleague Sam Millette, manager, fixed income on Commonwealth’s Investment Management and Research team, has helped me put together this month’s Market Risk Update. Thanks for the assist, Sam!
Markets continued their rough start to the year, as all three major U.S. indices saw declines in February for the second straight month. Concerns about inflation and the Russian invasion of Ukraine caused uncertainty and led to sell-offs across global equity markets. The S&P 500 lost 2.99 percent during the month, while the Dow Jones Industrial Average (DJIA) dropped by 3.29 percent. The technology-heavy Nasdaq Composite saw the largest losses, with the index declining by 3.35 percent. The story was similar internationally, as both the MSCI EAFE and Emerging Market indices saw declines as well. The continued sell-off served as an important reminder that real risks to markets remain and should be monitored. So, what do the risks look like now?
Recession Risk
Recessions are strongly associated with market drawdowns; in fact, 8 of 10 bear markets have occurred during recessions. The National Bureau of Economic Research, which declared that a recession started in February 2020 when markets plunged, announced that it ended shortly thereafter. Despite that and the ongoing expansion since then, economic risks remain.
On the whole, the economic recovery continued in February, although uncertainty about the path toward recovery remains. The primary risk is a deeper slowdown in growth, driven by lowered business and consumer confidence in February. Given the risk of further damage to confidence from inflation and war news, we have kept the economic risk level at a yellow light for now. Although the most likely path forward is continued economic growth, the lowered confidence is a reminder that the recovery pace is uncertain, and we will likely see setbacks along the way.
Economic Shock Risk
One major systemic factor is the price of money, otherwise known as interest rates. They drive the economy and financial markets—and, historically, have been able to derail them. Rates have been causal factors in previous bear markets and deserve close attention.
Risk factor #1: The yield curve (10-year minus 3-month Treasury rates). We cover interest rates in the economic update, but they warrant a look here as well.
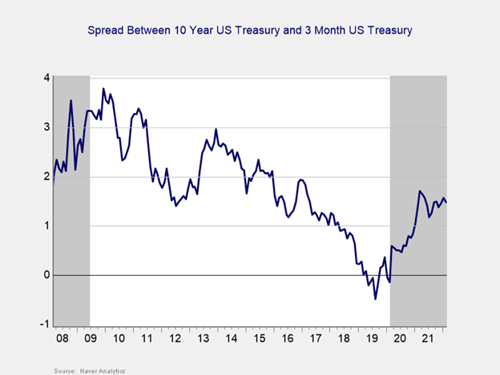
The yield curve flattened slightly in February. This result was primarily caused by rising short-term interest rates, as the 3-month Treasury yield increased from 0.22 percent at the end of January to 0.35 percent at the end of February. This increase for short-term yields was more than enough to offset a smaller rise in long-term rates during the month. The 10-year Treasury yield increased from 1.79 percent at the end of January to 1.83 percent at the end of February. The rise in both short- and long-term yields was primarily due to rising expectations for a rate hike at the Fed’s next meeting in March due to high levels of consumer and producer inflation.
Economists expect to see the Fed focused on combating inflation in 2022, which could lead to more frequent rate hikes as the central bank tries to normalize monetary policy. Economists view the expected Fed rate hikes as a signal that the Fed views the economy as healthy enough to endure a faster return to normal.
While this normalization process is a good sign for the ongoing economic recovery and could help tamp down high levels of inflationary pressure, rising rates can have a negative effect on stocks, as we saw to start the year. Given the potential negative impact from rising rates on equities, we have kept this signal as yellow for now with a potential downgrade to red in the months ahead.
Signal: Yellow light
Market Risk
Beyond the economy, we can also learn quite a bit by examining the market itself. For our purposes, two things are important:
- To recognize which factors signal high risk
- To try to determine when those factors signal that the risk has become an immediate—rather than theoretical—concern
Risk factor #1: Valuation levels. When assessing valuations, we find longer-term metrics (particularly the cyclically adjusted Shiller P/E or price-to-earnings ratio, which looks at average earnings over the past 10 years) to be the most useful in determining overall risk.
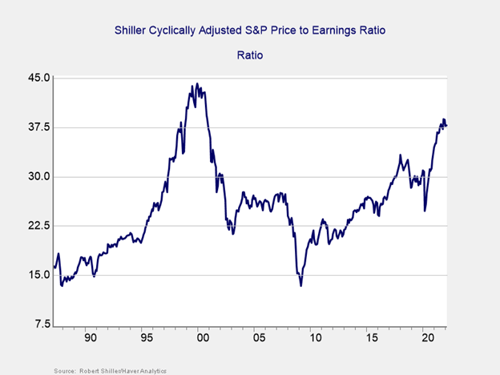
Valuations increased modestly in February, yet remain below recent highs, as the Shiller CAPE ratio rose from 37.73 in January to 37.79 in February. This result left the index below the recent high of 38.75 that we saw in November of last year.
Even though the Shiller CAPE ratio is a good risk indicator, it’s a terrible timing indicator. To get a better sense of immediate risk, let’s turn to the 10-month change in valuations. Looking at changes rather than absolute levels gives a sense of the immediate-risk level because turning points often coincide with changes in market trends.
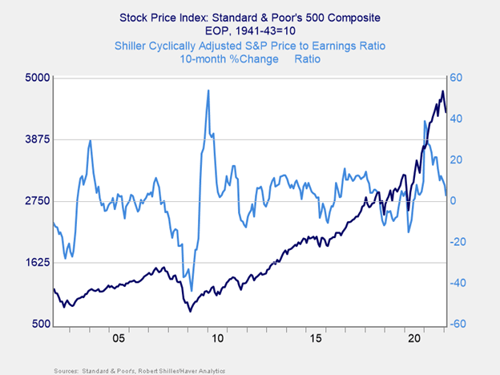
Above, you can see that when valuations roll over—with the change dropping below zero over a 10-month or 200-day period—the market itself typically drops shortly thereafter. This relationship held at the start of the pandemic, as valuations and the index rolled over before rebounding. On a 10-month basis, valuations rose by 2.91 percent during the month, down from the 7.68 percent increase we saw in January and moving significantly closer to the risk zone. Given the substantial drop in the trend line close to the risk zone and the historically high valuation levels, we have dropped this indicator to a red light.
Signal: Red light
Risk factor #2: Margin debt. Another indicator of potential trouble is margin debt.
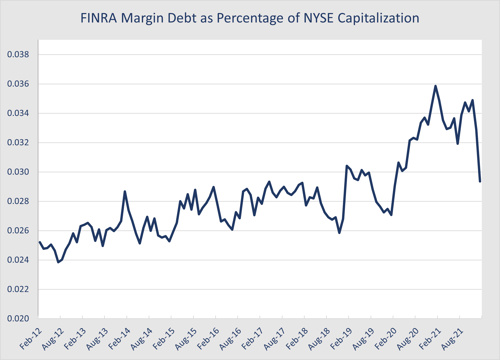
Debt levels as a percentage of market capitalization increased notably at the start of the pandemic and throughout 2020. Since then, we have seen margin debt largely decline from the recent highs we saw in late 2020. Margin debt dropped sharply in January, bringing margin debt as a percentage of market capitalization down to its lowest level since the start of the pandemic; however, the overall level of margin debt remains high on a historical basis. The high level of debt associated with the market is a risk factor on its own but not necessarily an immediate one.
For immediate risk, changes in margin debt over a longer period are a better indicator than the level of that debt. Consistent with this, if we look at the change over time, spikes in debt levels typically precede a drawdown.
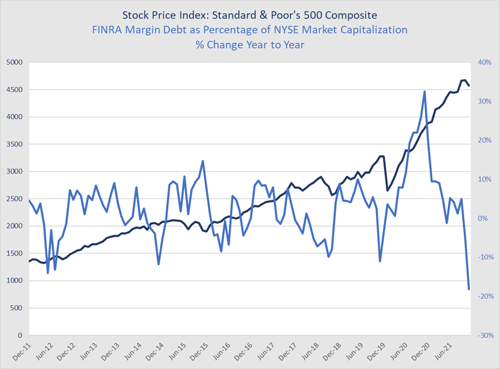
As you can see in the chart above, margin debt as a percentage of market capitalization declined by 18.16 percent on a year-over-year basis in January, following a 4.91 percent drop in December. This marks one of the largest year-over-year declines in margin debt on record, echoing similar declines last seen at the start of 2002.
Although margin debt as a percentage of market capitalization declined notably in January, the high absolute level of margin debt as a percentage of market capitalization is worth monitoring. We have kept this indicator at a yellow light for now.
Signal: Yellow light
Risk factor #3: Technical factors. A good way to track overall market trends is to review the current level versus recent performance. Two metrics we follow are 200-day and 400-day moving averages. We start to pay attention when a market breaks through its 200-day average, and a breakthrough of the 400-day average often signals further trouble ahead.
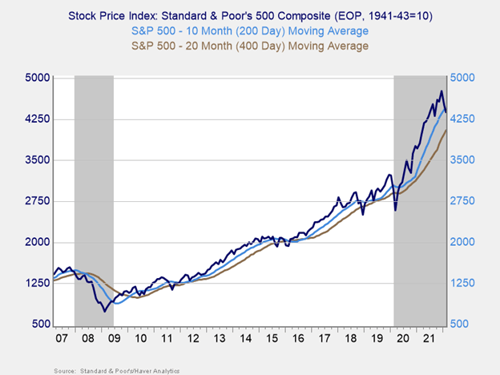
Technical factors turned negative for major U.S. equity markets in February. The S&P 500, DJIA, and Nasdaq Composite all ended the month below their respective 200-day moving averages. This marks the first time that all three major indices have finished the month below trend since March 2020 when initial lockdowns were implemented.
The 200-day trend line is an important technical signal that is widely followed by investors, as prolonged breaks above or below could indicate a longer-term shift in investor sentiment for an index. The 400-day trend line is also a reliable indicator of a change in trend. While it’s too early to say that the drop below trend for equities signals a true change in sentiment for investors, the negative technical signals during the month are a cause for concern; therefore, we’ve downgraded this indicator to red.
Signal: Red light
Risk factor #4: Market complacency. This is a recently added risk factor that aims to capture a standardized measure of market complacency across time. Complacency can be an uncertain term, so this chart identifies and combines two common ways to measure complacency: valuations and volatility.
For the valuation component of the index, we are using the forward-looking, price-to-earnings ratio for the S&P 500 over the next 12 months. This gives an idea of how much investors are willing to pay for companies based on their anticipated earnings. Typically, when valuations are high, it signals investors are confident and potentially complacent. For volatility, we have used the monthly average level for the VIX, a stock market volatility index. When volatility for the S&P 500 is high, the VIX rises, which would signal less complacency.
By combining the two metrics in the chart below, we see periods where high valuations and low volatility have caused peaks, such as 2000, 2006–2007, and 2017. We saw market drawdowns within roughly one year following each of these peaks.
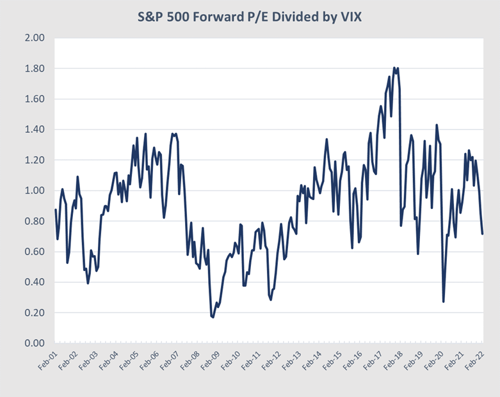
Source: Haver Analytics, FactSet
Looking at the current chart, market complacency continued to drop in February following a decline in January. The average VIX reading increased from 23.18 in January to 25.75 in February, marking the highest average monthly VIX level since October 2020. The forward-looking P/E ratio for the S&P 500 declined during the month, falling from 19.7 in January to 18.5 in February, which is the lowest level since the start of the pandemic. The combination of increasing volatility and declining valuations caused the overall index to drop notably in February. This market complacency index fell from 0.85 in January to 0.72 in February, which marks the lowest level for the index since October 2020.
Readings exceeding 1.2 have historically been a signal that market complacency may be at concerning levels. So, the pullback for the index in February is a sign that complacency continued to fall back from the potential danger zone we hit in October of last year. Given the continued pullback for the indicator in February, we have left this signal as a green light.
Signal: Green light
Conclusion: Sell-Off Highlights Risks to Equity Markets
The continued market sell-off in February served as a reminder that real risks for markets exist and should be monitored. Interest rates continue to be a potential cause for concern, and the Russian invasion of Ukraine near month-end added further uncertainty for markets.
Another component worth noting is the change in oil prices. This was originally an indicator we tracked, but given steady pricing over the past decade stopped using it. Now that prices are highly volatile—and at the highest level in years—we took another look, and this, too, is at a red light. Given this, the risks to the market are clearly to the downside.
That said, it is certainly possible that we will see continued market appreciation in the months ahead, provided we see continued economic growth. But right now, the risks have moved significantly higher.
Ultimately, the path back to a more normal economic and market environment will likely be long, and we can expect setbacks along the way. Given the fact that many of the indicators we track in this update have dropped to red, we have taken the overall market risk level down to a red light for now.