Print
Print My colleague Sam Millette, senior investment research analyst on Commonwealth’s Investment Management and Research team, has helped me put together this month’s Market Risk Update. Thanks for the assist, Sam!
It’s time for our monthly look at market risk factors. We had a strong start to the year, with U.S. markets at all-time highs by mid-January. But a risk-off sentiment driven by the spread of the coronavirus from China spooked investors, leading to modest declines for equity markets at month-end. Markets have since recovered and moved back to new highs, but that does not necessarily mean the risks have disappeared. Just as with the economy, there are several key factors that matter for the market in determining both the risk level and the immediacy of the risk.
Recession risk
Recessions are strongly associated with market drawdowns. Indeed, 8 of 10 bear markets have occurred during recessions. As we discussed in this month’s Economic Risk Factor Update, right now the conditions that historically have signaled a potential recession are not in place; in fact, conditions are improving. There are, however, signs that risks are out there, highlighted by the recent re-inversion of the 10-year and 3-month yield curve at month-end. On an absolute basis, most of the major signals are not yet in a high-risk zone, and January’s data releases largely came in better than expected. With that being said, all five of the major economic signals are still at a yellow light. As such, we have kept economic factors at a yellow light for February.
Economic shock risk
There are two major systemic factors—the price of oil and the price of money (better known as interest rates)—that drive the economy and the financial markets, and they have a proven ability to derail them. Both have been causal factors in previous bear markets and warrant close attention.
The price of oil. Typically, oil prices cause disruption when they spike. This is a warning sign of both a recession and a bear market.
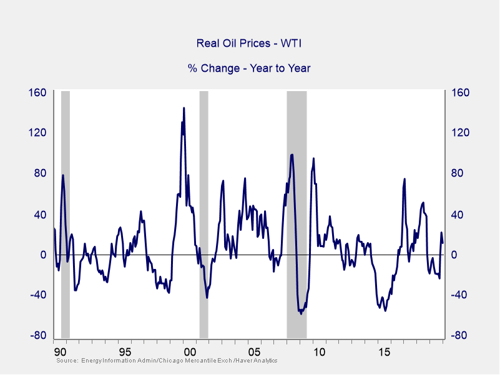
The price of oil increased by 11.7 percent on a year-over-year basis in January. But this increase was largely technical in nature and due to a sharp drop in oil prices at the end of 2018 that lasted through the first few months of 2019. On a month-over-month basis, prices actually declined by 3.8 percent in January, despite the increased tensions between the U.S. and Iran. January’s average spot price per barrel of $57.53 is well below the one-year high of $63.86 that we saw in April, so there is no immediate cause for concern. As such, we’ll leave this indicator at a green light for now.
Signal: Green light
The price of money. We cover interest rates in the economic update, but they warrant a look here as well.
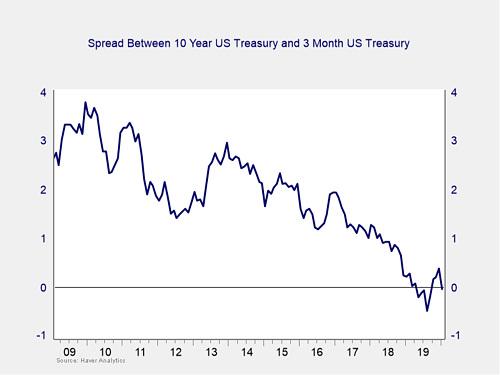
After spending three straight months un-inverted, the yield curve re-inverted at month’s end, driven by falling long-term rates. The yield on the 10-year Treasury note fell from 1.88 percent at the start of the month to 1.56 percent at month-end, while the 3-month Treasury yield rose slightly from 1.54 percent to 1.58 percent at month-end. The decline in long-term yields was due in large part to fears about the potential impact of the coronavirus on global growth, rather than worsening economic fundamentals here in the U.S. The risk of a recession in the future still remains, as historically we’ve seen recessions follow un-inversions of the yield curve within 12 months. We are keeping this measure at a yellow light for this month, with a potential move to red on the horizon if this inversion continues.
Signal: Yellow light
Market risk
Beyond the economy, we can also learn quite a bit by examining the market itself. For our purposes, two things are important:
- To recognize what factors signal high risk
- To try to determine when those factors signal that risk has become an immediate, rather than theoretical, concern
Risk factor #1: Valuation levels. When it comes to assessing valuations, we find longer-term metrics—particularly the cyclically adjusted Shiller P/E ratio, which looks at average earnings over the past 10 years—to be the most useful in determining overall risk.
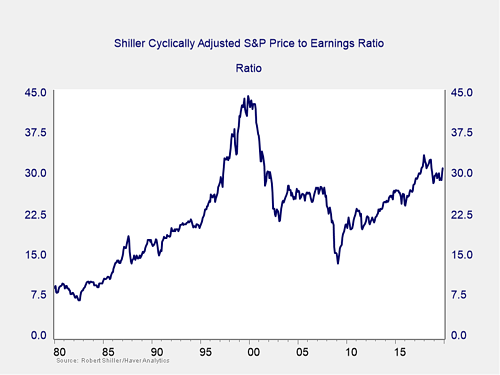
The major takeaway from this chart is that, with the run-up in 2019, valuations remain extremely high. They are still above the levels of the mid-2000s, although down from recent highs. Despite the drop, stocks remain quite expensive based on history. High valuations are associated with higher market risk—and longer-term metrics have more predictive power. So, this is definitely a sign of high risk levels.
Even as the Shiller P/E ratio is a good risk indicator, however, it is a terrible timing indicator. To get a better sense of immediate risk, we can turn to the 10-month change in valuations. Looking at changes, rather than absolute levels, gives a sense of the immediate risk level, as turning points often coincide with changes in market trends.
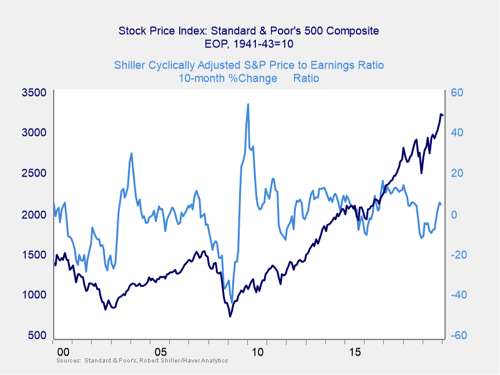
Here, you can see that when valuations roll over, with the change dropping below zero over a 10-month or 200-day period, the market itself typically drops shortly thereafter. Markets started off January strong, hitting all-time highs here in the U.S. by midmonth. Fears over the spread of the coronavirus and the potential impact on global growth led to a global flight to safety trade at month-end, which brought the S&P 500 to a modest decline of –0.04 percent for the month. Markets have since recovered and set new highs in February. We are keeping this indicator at yellow due to the fact that we remain above the levels of 2011 and 2015–2016. But with another month of improvement, this indicator could move back to green.
Signal: Yellow light (trending toward green)
Risk factor #2: Margin debt. Another indicator of potential trouble is margin debt.
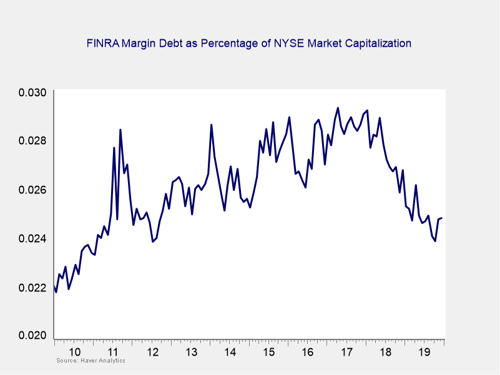
Debt levels as a percentage of market capitalization dropped substantially over the course of 2019, to close to the lowest levels of the recovery. Margin debt remains at the low end of recent history, but it remains high by historical standards. The overall high levels of debt are concerning; however, as noted above, high risk is not immediate risk.
For immediate risk, changes in margin debt over a longer period are a better indicator than the level of that debt. Consistent with this, if we look at the change over time, spikes in debt levels typically precede a drawdown. Margin debt as a percentage of market cap is well below highs seen in 2017 and 2018 and continued to fall throughout much of 2019.
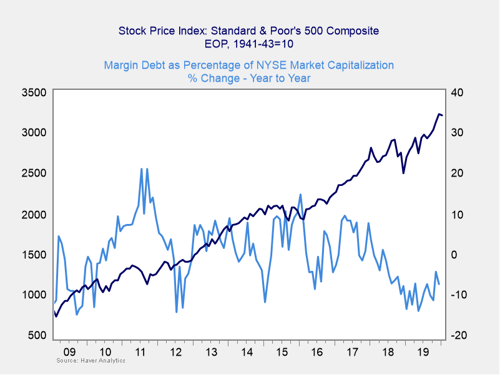
As you can see in the chart above, the annual change in debt as a percentage of market capitalization remains below zero, despite the uptick near year-end. This indicator is not signaling immediate risk at this point but has been volatile in recent months. Given that, and the fact that the overall debt level remains high historically, it is worth watching. So, we are keeping this indicator at a yellow light. Again, we are trending toward the lowest risk levels of the recovery from this indicator, so an upgrade to green may be only a couple of months away.
Signal: Yellow light
Risk factor #3: Technical factors. A good way to track overall market trends is to review the current level versus recent performance. Two metrics we follow are the 200- and 400-day moving averages. We start to pay attention when a market breaks through its 200-day average, and a break through the 400-day often signals further trouble ahead.
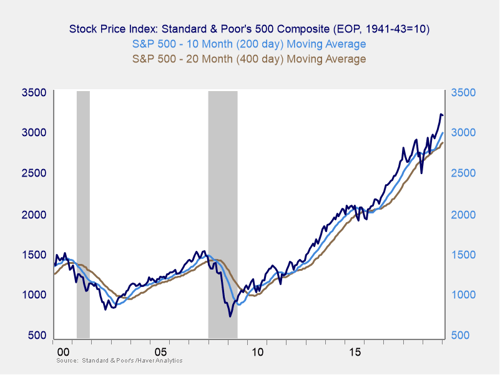
The decline at the end of 2018 took all three major U.S. indices below the 400-day trend lines, a significant support level. The subsequent recovery brought them back above both that level and the 200-day level. But in May, we had a brief break back below the 200-day trend line, followed by a recovery, and then another brief break below in June and further weakness in August. Markets responded to the August weakness well, with four straight positive months before January’s modest decline broke the streak.
Despite this decline to start the year, U.S. markets remain well supported technically. As we saw toward the end of January, volatility can strike at any time. We will continue to leave this signal at a yellow for now.
Signal: Yellow light
Conclusion: Market risks moderate, but economic risks remain
Market risks have been at the yellow light level for the past 23 months and recently dropped even further with the hint of some red lights. But market conditions have largely improved over the past few months, despite turbulence at the end of January. Fundamentals have also been improving, with better-than-expected results for some of the most closely watched economic updates that were released in January. Despite these improvements, there are still very real reasons for caution given geopolitical uncertainty and the potential for short-term volatility.
The market recovery to end the year following August’s volatility is encouraging, as is the initial market recovery in February. Although neither of the likely shock factors is necessarily indicating immediate risk, recent signs of economic weakness—combined with the fact that several of the market indicators continue to point to an elevated level of risk—suggest that volatility can appear at any time. As we saw at the end of the month, outside factors can swiftly affect markets.
As such, we are keeping the overall market indicator at a yellow light. This is not a sign that risks have passed. Instead, it is a recognition that basic conditions remain supportive and that while risks are real, the most probable course is more appreciation—even though further volatility is quite possible.