Print
PrintMy colleague Sam Millette, senior investment research analyst on Commonwealth’s Investment Management and Research team, has helped me put together this month’s Economic Risk Factor Update. Thanks for the assist, Sam!
The economic data released in January largely came in better than expected. Improvements to service sector and consumer confidence and the positive January jobs report were highlights. The only disappointing result was the re-inversion of the 10-year and 3-month Treasury yields. But this re-inversion was largely caused by concerns about the coronavirus and its potential impact on global growth, rather than concerns with U.S. economic conditions. All things considered, January was a positive month for economic updates and a solid start to the year.
The Service Sector
Signal: Yellow light
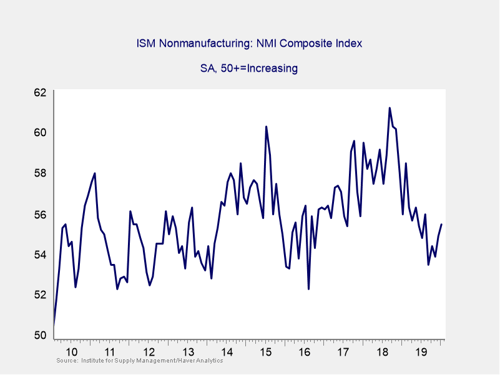
This measure of service sector confidence continued to improve in January, increasing from 54.9 in December to 55.5 in January. This result was better than economist estimates for a move up to 55.1. This is a diffusion index, where values above 50 indicate expansion. So, this improvement is a positive development, especially considering a similar improvement to manufacturer confidence that we saw to start the year. The combined measure of manufacturer and nonmanufacturer confidence sits at levels that have historically indicated roughly 1.5 percent GDP growth. This is the fourth month in a row where the index has come in above the three-year low of 53.5 that was set in September. Despite the improvement we’ve seen over the past few months, service sector confidence still sits below recent highs seen in 2018. As such, we are keeping this signal at a yellow light for now, although an upgrade to green is becoming probable in the near future if trends continue to be positive.
Private Employment: Annual Change
Signal: Yellow light
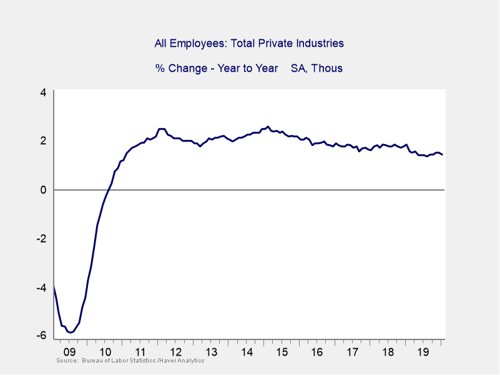
January’s employment report came in much better than expected, with 225,000 new jobs added against forecasts for 165,000. This number is a solid improvement from the disappointing 147,000 new jobs that were added in December. The rolling three-month average for new jobs created now sits at 211,000, which is an impressive recovery from the almost seven-year low of 119,000 that we hit last April. We moved this indicator to a yellow light three months ago. Given the mixed results we’ve seen since then, and the fact that the annual change continues to inch down, we will leave it at yellow for now.
Private Employment: Monthly Change
Signal: Yellow light
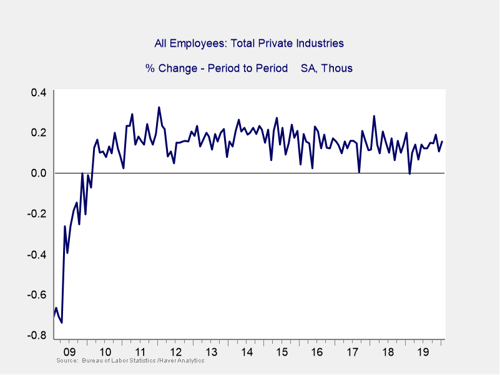
These are the same numbers as in the previous chart but on a month-to-month basis, which can provide a better short-term signal.
The pace of month-over-month job growth picked up in January, rising by the second-fastest monthly rate in more than a year. The headline jobs figure came in better than expected, and the underlying data was mostly positive as well. Average hourly earnings grew by 3.1 percent year-over-year, against expectations for 3 percent growth. The unemployment rate did increase modestly from 3.5 percent in December to 3.6 percent in January. This increase was driven by a surge of people looking for jobs, as the labor force participation rate rose from 63.2 percent to 63.4 percent. The better-than-expected headline result to start the year indicates that the acceleration in new job creation we saw at the end of 2019 is continuing into the new year. Given the strong headline job creation, we will leave this indicator at a yellow, with an eye on changing to green if we see consistent improvement.
Yield Curve (10-Year Minus 3-Month Treasury Rates)
Signal: Yellow light
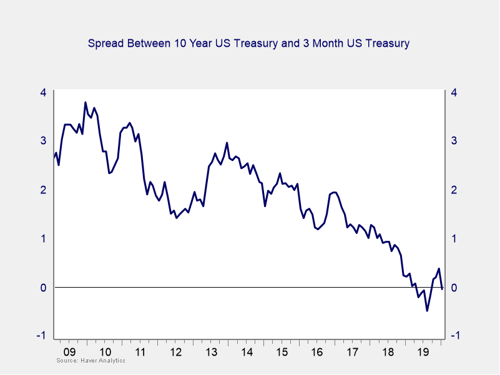
After spending three straight months un-inverted, the yield curve re-inverted at month’s end, driven by falling long-term rates. The yield on the 10-year Treasury note fell from 1.88 percent at the start of the month to 1.56 percent at month-end, while the 3-month Treasury yield rose slightly from 1.54 percent to 1.58 percent at month-end. The decline in long-term yields was due in large part to fears about the potential impact of the coronavirus on global growth, rather than worsening economic fundamentals here in the U.S. The risk of a recession in the future still remains, as historically we’ve seen recessions follow un-inversions of the yield curve within 12 months. We are keeping this measure at a yellow light for this month, with a potential move to red on the horizon if this inversion continues.
Consumer Confidence: Annual Change
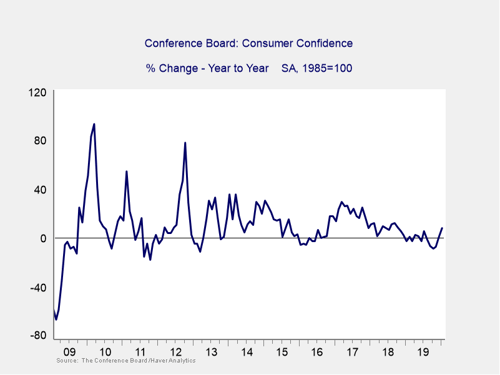
Signal: Yellow light
Consumer confidence increased by more than expected in January, and December’s initially disappointing result was revised upwards. The Conference Board Consumer Confidence Index increased from an upwardly revised 128.2 in December to 131.6 in January, against economist expectations for a move to 128. This jump brought the index to a four-month high and marks two straight months where confidence has increased on a year-over-year basis, calming concerns of sustained declines. Despite negative year-over-year results from August to November, the annual change in confidence has managed to stay well above the –20 percent year-over-year decline that has historically put pressure on spending growth. We’ll continue to leave this indicator at a yellow light for now, but continued improvements could lead to an upgrade to green.
Conclusion: Risk moderates but remains significant
January’s data releases largely came in better than expected, showing that the economy is on solid footing to start the year. Given the fundamentals, we expect growth to continue at a muted pace as we move into 2020. The better-than-expected jobs report and consumer confidence figures helped calm concerns of a slowdown in consumer spending and showed the resilience of the American consumer. Improved business confidence is also a tailwind for future growth, as it could lead to additional business investment, which was lacking in 2019.
Despite these improvements on a monthly basis, the year-on-year trends indicate that risks remain. Although continued slow growth remains the most likely case based on the data, the chances of a recession within the next 12 months cannot be dismissed, as seen by the re-inversion of the yield curve. Right now, however, slow growth is not a recession, even as the bulk of the data indicates the risks of further slowdown remain material. As such, we are leaving the overall risk level at a yellow light for the economy as a whole for February.