

 Print
Print The good news is that the second wave of infections looks to have peaked and turned back down in the past two weeks. Case growth is down significantly from the peak, and the case growth rate has ticked back down to the lows seen in mid-June. Two weeks ago, we discussed the peak of the second wave, and this decline is the next step. The data indicates that, in most states, outbreaks are being contained.
At the national level, as of August 12, the daily spread rate is now down to around 1 percent per day, close to the lowest levels of the pandemic so far and down from a recent high of 2 percent. The daily number of new cases was about 55,000, almost the same as a week ago and steady for the past two weeks. If this holds, the pandemic will have come under control again, albeit at a higher infection level than we saw six weeks ago. This is a significant improvement over mid-July.
The testing news is more mixed. The number of tests has trended down over the past two weeks, from more than 800,000 per day to around 700,000 in the past week, with the most recent testing day dropping even further. The decline in tests has not been because of a slowdown in infections, as the positive rate has held at between 7 percent and 8 percent, with a recent spike above that level. This is a metric that will need to improve to keep the virus under control, and the recent data is moving in the wrong direction.
Beyond the headline numbers, state-level data is generally good but with some worrying signs. Case growth in California remains high, but most of the worst affected states (including Florida and Texas) appear to have peaked, as people and governments there have started to reimpose social distancing and other restrictions. Plus, Georgia is stabilizing. These changes show that policy measures are constraining further increases. Overall, the national risks remain under control.
With the medical news better, the economic recovery remains on track. The job market continues to improve, although signs of a slowdown in spending are something to keep an eye on. The financial markets also continue to move higher in response to the positive developments. Let’s take a look at the details.
Pandemic growth continues to decline
Growth rate. Over the past two weeks, the daily case growth rate has ticked down from 1.5 percent to 1 percent per day, close to the lowest level of the pandemic thus far. This movement suggests that even as the case count remains elevated, the spread is slowing. At this rate, the case-doubling period has risen to about 10 weeks, up from 7 weeks. This leaves the infection curve flatter at a national level, and most states are now at the lower spread rates, which limit the risk to their health care systems.
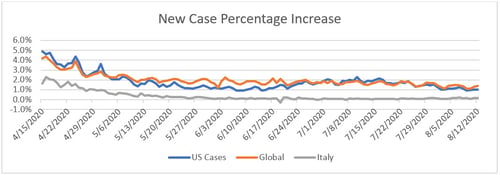
Source: Data from worldometer.com
Daily testing rate. Despite the rise in infections, testing rates have decreased, from more than 800,000 per day two weeks ago to around 700,000 per day, with the most recent data showing a sharp drop. The drop is only one day so far, but the downward testing trend is a problem. This is well below the level of testing needed to develop a full understanding of the pandemic, despite the recent improvements in the spread rate.
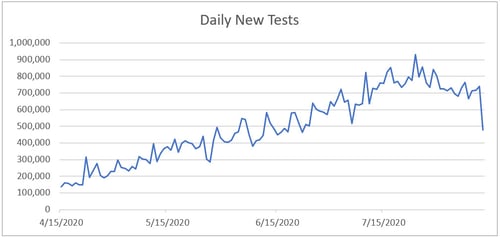
Source: Data from the COVID Tracking Project
Positive test results. We can see this lack of progress by the positive rate on tests. If we look at the percentage of each day’s tests that are positive, lower numbers are better as we want to be testing everyone and not just those who are obviously sick. The World Health Organization recommends a target of 5 percent or lower; the lower this number gets, the wider the testing is getting. Here, we can see that the positive level has remained steady at between 7 percent and 8 percent, with a recent spike on yesterday’s data. This data shows that we are largely just testing the people who are sick, which is insufficient to keep the pandemic under control.
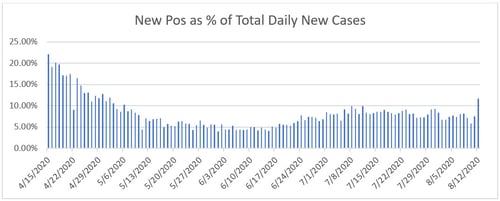
Source: Data from the COVID Tracking Project
New cases per day. The most obvious metric for tracking the virus is daily new cases. With increased control measures in place, especially in the outbreak states, the number of new cases per day has dropped from the recent high of more than 70,000 per day down to around 55,000 per day, and it has been steady for the past couple of weeks. The new case growth comes from a wide range of states now, although the worst hit have now peaked.
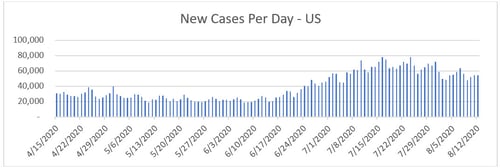
Source: Data from worldometer.com
Total active cases. Active case growth has also ticked up over the past two weeks, although at a slower rate. While new infections are still outpacing recoveries, the gap is narrowing.
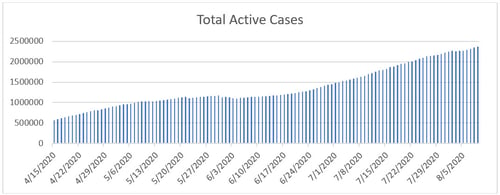
Source: Data from worldometer.com
Overall, the pandemic has been brought back under control at the national level, and we’re seeing significant drops in case growth in many states. The good news here is that policy and behavioral changes are taking effect, as they did in the first wave, and we have largely contained the virus as we did then. The risk of a national shutdown is now quite small. Looking forward, the pandemic seems to have stabilized at the same growth rate as we saw in mid-June, albeit the higher number of cases means the daily new case growth remains higher.
Economic recovery stable but showing signs of potential weakness
The economic news is better, with the recovery continuing. The most recent initial jobless claims reports have started dropping again, signaling fewer layoffs. Further, the continuing unemployment claims have also improved, while the most recent jobs report showed 1.76 million new jobs were created last month. Improvement in the jobs market remains a relative bright spot as businesses continue to figure out how to operate under the constraints of the pandemic.
Signs of weakness. That said, there are signs of weakness. Consumer confidence has ticked down, although it remains above the recent bottoms. Higher-frequency spending data has held up through the second wave of infections, but recently it has softened further (see chart below) despite the improvements in the medical news. This is something to watch, as spending held up well through the second wave. Looking forward, medical risks might not be the key issue. Instead, spending and the recovery look to depend to some extent on whether further federal unemployment insurance support is provided.
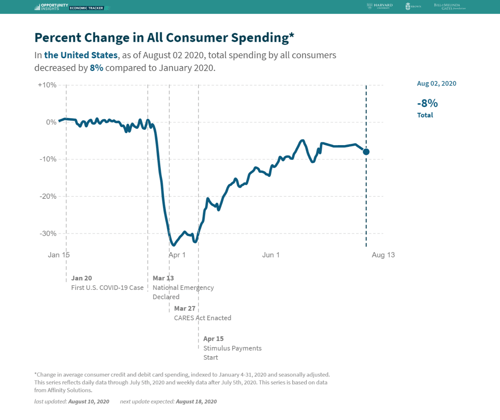
Source: tracktherecovery.org
Finally, we can see similar signs of a moderation in general, as well as a slowdown in some specific sectors, in this composite of many indicators from J. P. Morgan.
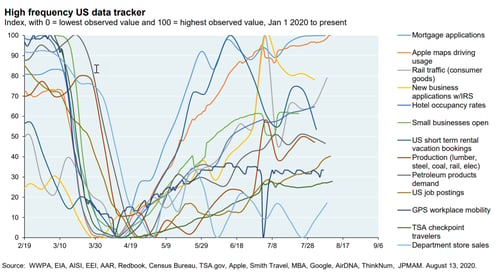
Source: J.P. Morgan
The risks. Although the recovery is still on track and the medical risks have moderated, the economic risks are becoming more apparent. The biggest is that much of the confidence and spending recovery was due to federal income support. If that is not renewed, we could see further declines. While the slowdown so far has been limited, a deeper drop remains a risk.
Financial markets approach new highs
Financial markets have appreciated steadily over the past two weeks in response to the positive news. On the medical front, markets have responded to the stabilization in the new case count and encouraging news on vaccine development. On the economic front, corporate earnings are coming in better than expected. Overall, markets remain supported by ongoing positive developments, but they are very aware of the risks. The good news is that as we get more data, markets seem to be developing a firmer foundation.
Continued improvement ahead?
The real takeaway for this update is that the second wave has now largely been brought under control, just as the first wave was. The medical risks are now contained, although further future improvement is not guaranteed. The economic risks, however, have risen somewhat, with declines in confidence and spending, plus risks around the extension of federal income support.
While the risks are real, there is also the likelihood that continued medical improvement will support confidence and spending growth again and that federal support will be renewed. Therefore, the most likely case appears to be continued improvement on both the medical and economic fronts.


